- こちらで疾患の時系列変化を作ってみた
- 疾患の経時的記録(カルテ)は、この指標を測定したり、あの指標を測定したり、と、測定時点がてんでんばらばら。それなのに、何かしらの判断が働いて、行動が起こされる
- その判断を決めているものは何なのか、その判断は適切なのか、を考えるには、ぱらぱらと記録された情報同士の関係などを数値に変えてから考える、という戦略は悪くない
- こちらで、時系列にLinear mixed modelをあてはめてみた
- こちらでは、ぱらぱらと得られる情報の観測時点間を補完するための方法を書いた
- 臨床データでは、「ターニングポイント」で測定することが多い。言い換えれば、観測データがある時点を境に、状況が変わっていることが多いから、補間は折れ線で行うのが最も適当(それは、最も単純でもあり、大概の場合、単純な仕組みが最適)なので、linearな補間をmethodとして採用してみる
- どういうときに「関連がある」のか
- 単位根に関すること
- 時系列データの解釈においては、全体のトレンドが似ているときに、それだけで関連がある、と言ってはいけないことがある。「単位根の問題」として経済統計では扱われるらしい(単位根についての経済統計における一般論は、こちら、そして、それが「時代遅れ」だという批評についてはこちら)
- このことは、2つの時系列データが「見た目は良く揃っている」ように見えつつ、実際の関連が実は強くない、という解釈の説明となる(ようだ)
- あれやこれや、考えあわせるに、ひとまず、時系列データをうまく扱えるように地ならしをしたい
- 観測データには大きく2種類ある
- 量的なもののある瞬間の値を測定するもの(バイオマーカーなど)
- 一定期間にわたって、同一の値を与えるもの(治療、遺伝要因など)
- 差分・加算をうまく扱いたい
- 単位時間を与えて(日とか週とか)時間を離散的にするのが便利
- こうすると、瞬間観測の項目と一定期間同一値の項目との両方を「折れ線」データとして扱える
- 補間
- 上述したような理由で1次線形補間をする(折れ線化)
- 関連を見るとき
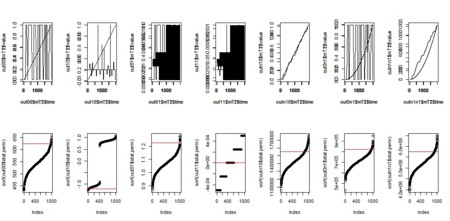
- 値の折れ線グラフが2本あって、その関連を数値化して統計量とする(その珍しさの判定は、パーミュテーションしてみる)
- 2つの観察項目について、そのまま・差分・加算 の3通りがあるとして、その組合せについて同様に検討する
- 以下は、そのお試し
my.diff<-function(time,value){
ord<-order(time)
diff.t<-diff(time[ord])
diff.v<-diff(value[ord])
tmp.value<-diff.v/diff.t
tmp.time<-(time[ord])[1:(length(time)-1)] + diff.t/2
return(list(time=tmp.time,value=tmp.value))
}
my.integral<-function(time,value){
ord<-order(time)
cum.v<-c(0,cumsum(value[ord]))
diff.t<-diff(time[ord])
cum.t<-c(time[ord][1]-diff.t[1]/2,(time[ord])[1:(length(time)-1)]+diff.t/2,time[ord][length(time)]+diff.t[length(diff.t)]/2)
return(list(time=cum.t,value=cum.v))
}
library(pracma)
myModify<-function(time,value,d,method="linear"){
if(d==0){
return(list(time=time,value=value))
}else if (d==1){
Range<-range(time)
intvl<-min(diff(sort(unique(time))))
wt<-seq(from=Range[1],to=Range[2],by=intvl)
tmp<-interp1(time,value,wt,method=method)
return(my.diff(wt,tmp))
}else if (d==-1){
Range<-range(time)
intvl<-min(diff(sort(unique(time))))
wt<-seq(from=Range[1],to=Range[2],by=intvl)
tmp<-interp1(time,value,wt,method=method)
return(my.integral(wt,tmp))
}
}
MakeWt<-function(time1,time2){
RangeWt<-range(time1)
RangeWt[1]<-max(RangeWt[1],min(time2))
RangeWt[2]<-min(RangeWt[2],max(time2))
seq(from=RangeWt[1],to=RangeWt[2],by=min(diff(sort(unique(c(time1,time2))))))
}
myCalcStat2<-function(X1,X2,wt,method="linear"){
Y1<-interp1(X1$time,X1$value,wt,method=method)
Y2<-interp1(X2$time,X2$value,wt,method=method)
ret<-anova(lm(Y1~Y2)[[5]][1])
if(is.na(ret)){
ret<-1
}
ret
}
my.TimeCorr<-function(T1,T2,di1=0,di2=0,method="linear",perm=TRUE,niter=1000){
mT1<-myModify(T1$time,T1$value,d=di1,method=method)
mT2<-myModify(T2$time,T2$value,d=di2,method=method)
wt<-MakeWt(mT1$time,mT2$time)
stat.ori<-myCalcStat2(mT1,mT2,wt,method=method)
if(!perm){
stat.perm<-NULL
perm.p<-NULL
}else{
stat.perm<-rep(0,niter)
for(i in 1:niter){
sh<-list(time=T1$time,value=T1$value[sample(1:length(T1$value))])
mT1sh<-myModify(sh$time,sh$value,d=di1,method=method)
stat.perm[i]<-myCalcStat2(mT1sh,mT2,wt,method=method)
}
perm.p<-length(which(stat.perm>stat.ori))/niter
}
list(mT1=mT1,mT2=mT2,wt=wt,stat.ori=stat.ori,stat.perm=stat.perm,perm.p=perm.p)
}
myCalcStat<-function(X1,X2,wt,method="linear"){
Y1<-interp1(X1$time,X1$value,wt,method=method)
Y2<-interp1(X2$time,X2$value,wt,method=method)
sum(Y1*Y2)
}
my.TimeCorr<-function(T1,T2,di1=0,di2=0,method="linear",perm=TRUE,niter=1000){
mT1<-myModify(T1$time,T1$value,d=di1,method=method)
mT2<-myModify(T2$time,T2$value,d=di2,method=method)
wt<-MakeWt(mT1$time,mT2$time)
stat.ori<-myCalcStat(mT1,mT2,wt,method=method)
if(!perm){
stat.perm<-NULL
perm.p<-NULL
}else{
stat.perm<-rep(0,niter)
for(i in 1:niter){
sh<-list(time=T1$time,value=T1$value[sample(1:length(T1$value))])
mT1sh<-myModify(sh$time,sh$value,d=di1,method=method)
stat.perm[i]<-myCalcStat(mT1sh,mT2,wt,method=method)
}
perm.p<-length(which(stat.perm>stat.ori))/niter
}
list(mT1=mT1,mT2=mT2,wt=wt,stat.ori=stat.ori,stat.perm=stat.perm,perm.p=perm.p)
}
out00<-my.TimeCorr(T1,T2,di1=0,di2=0)
out10<-my.TimeCorr(T1,T2,di1=1,di2=0)
out01<-my.TimeCorr(T1,T2,di1=0,di2=1)
out11<-my.TimeCorr(T1,T2,di1=1,di2=1)
outn10<-my.TimeCorr(T1,T2,di1=-1,di2=0)
out0n1<-my.TimeCorr(T1,T2,di1=0,di2=-1)
outn1n1<-my.TimeCorr(T1,T2,di1=-1,di2=-1)
par(mfcol=c(2,7))
plot(out00$mT1$time,out00$mT1$value,type="l")
par(new=TRUE)
plot(out00$mT2$time,out00$mT2$value,type="l")
plot(sort(out00$stat.perm),ylim=range(c(out00$stat.ori,out00$stat.perm)))
abline(h=out00$stat.ori,col=2)
plot(out10$mT1$time,out10$mT1$value,type="l")
par(new=TRUE)
plot(out10$mT2$time,out10$mT2$value,type="l")
plot(sort(out10$stat.perm),ylim=range(c(out10$stat.ori,out10$stat.perm)))
abline(h=out10$stat.ori,col=2)
plot(out01$mT1$time,out01$mT1$value,type="l")
par(new=TRUE)
plot(out01$mT2$time,out01$mT2$value,type="l")
plot(sort(out01$stat.perm),ylim=range(c(out01$stat.ori,out01$stat.perm)))
abline(h=out01$stat.ori,col=2)
plot(out11$mT1$time,out11$mT1$value,type="l")
par(new=TRUE)
plot(out11$mT2$time,out11$mT2$value,type="l")
plot(sort(out11$stat.perm),ylim=range(c(out11$stat.ori,out11$stat.perm)))
abline(h=out11$stat.ori,col=2)
plot(outn10$mT1$time,outn10$mT1$value,type="l")
par(new=TRUE)
plot(outn10$mT2$time,outn10$mT2$value,type="l")
plot(sort(outn10$stat.perm),ylim=range(c(outn10$stat.ori,outn10$stat.perm)))
abline(h=outn10$stat.ori,col=2)
plot(out0n1$mT1$time,out0n1$mT1$value,type="l")
par(new=TRUE)
plot(out0n1$mT2$time,out0n1$mT2$value,type="l")
plot(sort(out0n1$stat.perm),ylim=range(c(out0n1$stat.ori,out0n1$stat.perm)))
abline(h=out0n1$stat.ori,col=2)
plot(outn1n1$mT1$time,outn1n1$mT1$value,type="l")
par(new=TRUE)
plot(outn1n1$mT2$time,outn1n1$mT2$value,type="l")
plot(sort(outn1n1$stat.perm),ylim=range(c(outn1n1$stat.ori,outn1n1$stat.perm)))
abline(h=outn1n1$stat.ori,col=2)
par(mfcol=c(1,1))
plot(outn1n1$mT1$time,outn1n1$mT1$value)
plot(outn1n1$mT2$time,outn1n1$mT2$value)
library(MCMCpack)
Tmax<-100
Tlen<-2000
T<-seq(from=0,to=Tmax,length=Tlen)
Nsample<-5
VtParam<-sample(10:20,Nsample,replace=TRUE)
Disease<-function(ID=1,T,Tmax,Tlen,VtParam){
V<-runif(Tlen)
Vnatural<-cumsum(V)
Vt<-150-(rnorm(Tlen))*50
Vperiod<-100
r<-0.95
Vintervention<-rep(0,Tlen)
Vintervention[1]<-V[1]
Intervention<-rep(0,Tlen)
for(i in 2:Tlen){
if(max(Vintervention[max(1,i-Vperiod-1):(i-1)]-Vt[max(1,i-Vperiod-1):(i-1)])>0){
Vintervention[i]<-Vintervention[i-1]*r+V[i]
Intervention[i]<-1
}else{
Vintervention[i]<-Vintervention[i-1]+V[i]
}
}
Ct<-30
tmp<-Vintervention
tmp[tmp<Ct]<-0
tmp[tmp>=Ct]<-runif(1)
Cumul<-cumsum(tmp)
CumulSt<-Cumul/max(Cumul)
VinterventionSt<-Vintervention/max(Vintervention)
Tst<-T/max(T)
X<-cbind(rep(ID,Tlen),CumulSt,VinterventionSt,Intervention,Tst)
X
}
Out<-list()
for(i in 1:Nsample){
Out[[i]]<-Disease(ID=i,T,Tmax,Tlen,VtParam[i])
}
Out2<-NULL
for(i in 1:Nsample){
tmp<-Out[[i]][sample(1:length(Out[[i]][,1]),length(Out[[i]][,1])/100),]
print(tmp)
Out2<-rbind(Out2,tmp)
}
matplot(Out2,type="l",ylim=c(0,1))
pairs(Out2)
plot(Out2[1:(length(Out2[,1])-1),4],diff(Out2[,2]))
t.test(Out2[1:(length(Out2[,1])-1),4],diff(Out2[,2]))
library(lme4)
library(SASmixed)
(fm1<-lmer(diff(Out2[,2])~ Out2[1:(length(Out2[,1])-1),1] +(Out2[1:(length(Out2[,1])-1),4] | Out2[1:(length(Out2[,1])-1),1])))
anova(fm1)
V<-runif(Tlen)
Vnatural<-cumsum(V)
Vt<-150-(rnorm(Tlen))*50
Vperiod<-100
r<-0.95
Vintervention<-rep(0,Tlen)
Vintervention[1]<-V[1]
Intervention<-rep(0,Tlen)
for(i in 2:Tlen){
if(max(Vintervention[max(1,i-Vperiod-1):(i-1)]-Vt[max(1,i-Vperiod-1):(i-1)])){
Vintervention[i]<-Vintervention[i-1]*r+V[i]
Intervention[i]<-1
}else{
Vintervention[i]<-Vintervention[i-1]+V[i]
}
}
Ct<-30
tmp<-Vintervention
tmp[tmp<Ct]<-0
tmp[tmp>=Ct]<-runif(1)
Cumul<-cumsum(tmp)
CumulSt<-Cumul/max(Cumul)
VinterventionSt<-Vintervention/max(Vintervention)
Tst<-T/max(T)
X<-cbind(CumulSt,VinterventionSt,Intervention,Tst)
V<-runif(Tlen)
Vnatural<-cumsum(V)
Vt<-150-(rnorm(Tlen))*50
Vperiod<-100
r<-0.95
Vintervention<-rep(0,Tlen)
Vintervention[1]<-V[1]
Intervention<-rep(0,Tlen)
for(i in 2:Tlen){
if(max(Vintervention[max(1,i-Vperiod-1):(i-1)]-Vt[max(1,i-Vperiod-1):(i-1)])>0){
Vintervention[i]<-Vintervention[i-1]*r+V[i]
Intervention[i]<-1
}else{
Vintervention[i]<-Vintervention[i-1]+V[i]
}
}
Ct<-30
tmp<-Vintervention
tmp[tmp<Ct]<-0
tmp[tmp>=Ct]<-runif(1)
Cumul<-cumsum(tmp)
CumulSt<-Cumul/max(Cumul)
VinterventionSt<-Vintervention/max(Vintervention)
Tst<-T/max(T)
X<-cbind(CumulSt,VinterventionSt,Intervention,Tst)
matplot(X,type="l")
plot(X)
par(ask=TRUE)
Tlist<-list()
for(i in 1:length(X[1,])){
tmpT<-sort(sample(1:length(X[,i]),100))
Tlist[[i]]<-list(time=tmpT,value=X[tmpT,i])
}
for(i in 1:(length(X[1,])-1)){
for(j in (i+1):length(X[1,])){
T1<-Tlist[[i]]
T2<-Tlist[[j]]
out00<-my.TimeCorr(T1,T2,di1=0,di2=0)
out10<-my.TimeCorr(T1,T2,di1=1,di2=0)
out01<-my.TimeCorr(T1,T2,di1=0,di2=1)
out11<-my.TimeCorr(T1,T2,di1=1,di2=1)
outn10<-my.TimeCorr(T1,T2,di1=-1,di2=0)
out0n1<-my.TimeCorr(T1,T2,di1=0,di2=-1)
outn1n1<-my.TimeCorr(T1,T2,di1=-1,di2=-1)
par(mfcol=c(2,7))
plot(out00$mT1$time,out00$mT1$value,type="l")
par(new=TRUE)
plot(out00$mT2$time,out00$mT2$value,type="l")
plot(sort(out00$stat.perm),ylim=range(c(out00$stat.ori,out00$stat.perm)))
abline(h=out00$stat.ori,col=2)
plot(out10$mT1$time,out10$mT1$value,type="l")
par(new=TRUE)
plot(out10$mT2$time,out10$mT2$value,type="l")
plot(sort(out10$stat.perm),ylim=range(c(out10$stat.ori,out10$stat.perm)))
abline(h=out10$stat.ori,col=2)
plot(out01$mT1$time,out01$mT1$value,type="l")
par(new=TRUE)
plot(out01$mT2$time,out01$mT2$value,type="l")
plot(sort(out01$stat.perm),ylim=range(c(out01$stat.ori,out01$stat.perm)))
abline(h=out01$stat.ori,col=2)
plot(out11$mT1$time,out11$mT1$value,type="l")
par(new=TRUE)
plot(out11$mT2$time,out11$mT2$value,type="l")
plot(sort(out11$stat.perm),ylim=range(c(out11$stat.ori,out11$stat.perm)))
abline(h=out11$stat.ori,col=2)
plot(outn10$mT1$time,outn10$mT1$value,type="l")
par(new=TRUE)
plot(outn10$mT2$time,outn10$mT2$value,type="l")
plot(sort(outn10$stat.perm),ylim=range(c(outn10$stat.ori,outn10$stat.perm)))
abline(h=outn10$stat.ori,col=2)
plot(out0n1$mT1$time,out0n1$mT1$value,type="l")
par(new=TRUE)
plot(out0n1$mT2$time,out0n1$mT2$value,type="l")
plot(sort(out0n1$stat.perm),ylim=range(c(out0n1$stat.ori,out0n1$stat.perm)))
abline(h=out0n1$stat.ori,col=2)
plot(outn1n1$mT1$time,outn1n1$mT1$value,type="l")
par(new=TRUE)
plot(outn1n1$mT2$time,outn1n1$mT2$value,type="l")
plot(sort(outn1n1$stat.perm),ylim=range(c(outn1n1$stat.ori,outn1n1$stat.perm)))
abline(h=outn1n1$stat.ori,col=2)
par(mfcol=c(1,1))
}
}

