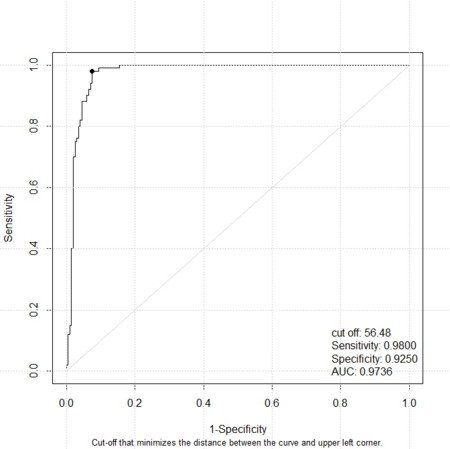
library(DiagnosisMed)

Ncase<-100
Ncont<-100
mean.case<-40
sd.case<-3

mean.cont<-35
sd.cont<-2
Case<-rnorm(Ncase,mean.case,sd.case)
Cont<-rnorm(Ncont,mean.cont,sd.cont)

boxplot(cbind(Case,Cont))

ra<-range(c(Case,Cont))

breaks<-seq(from=floor(ra[1]),to=ceiling(ra[2]),by=0.5)
h.cont<-hist(Cont,breaks=breaks,density=20)
h.case<-hist(Case,breaks=breaks,col=2,density=30)

ylim<-c(0,max(h.cont$counts,h.case$counts))

plot(h.cont,ylim=ylim,density=20)
par(new=TRUE)
plot(h.case,ylim=ylim,col=2,density=30)

V<-c(Case,Cont)
Pheno<-c(rep(1,Ncase),rep(0,Ncont))

ROC(Pheno,V)
