sasLM
# SASというアプリの”analysis of variance according to the general linear model (PROC-GLM)"を実行してくれるパッケージ
# Rのパッケージ"sasLM"をインストールする

install.packages("sasLM")
# パッケージsasLMを使えるようにRの実行環境に読み込む
library(sasLM)
- パッケージには84検体のデータ CO2がある
> head(CO2)
  Plant   Type  Treatment conc uptake
1   Qn1 Quebec nonchilled   95   16.0
2   Qn1 Quebec nonchilled  175   30.4
3   Qn1 Quebec nonchilled  250   34.8
4   Qn1 Quebec nonchilled  350   37.2
5   Qn1 Quebec nonchilled  500   35.3
- 各サンプルには5つの情報がついている
- Plant
- Type
- Treatment
- conc
- uptake
- それぞれの中身を見てみる
- Plantは12種類が7サンプルずつ
- Typeの2群 QuebecとMississippiに1,2,3,1,2,3という番号が付与してあって、それにより、12種類
> table(CO2$Plant)

Qn1 Qn2 Qn3 Qc1 Qc3 Qc2 Mn3 Mn2 Mn1 Mc2 Mc3 Mc1
  7   7   7   7   7   7   7   7   7   7   7   7
-
- Typeは2群であることがわかる
> table(CO2$Type)

     Quebec Mississippi
         42          42
-
- Treatmentは2種類の介入方法、nonchilledとchilled
> table(CO2$Treatment)

nonchilled    chilled
        42         42
-
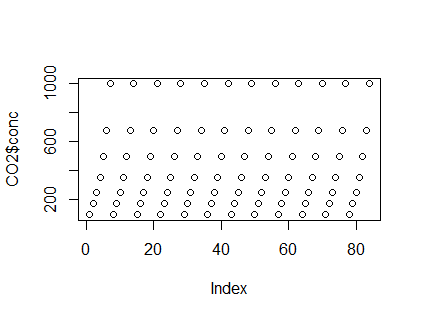
- concは実験「投与濃度」。異なる濃度を設定し、12種類のサンプルに7つずつの濃度で実験していることがわかる
plot(CO2$conc)

-
- uptakeは各サンプルで観測した、「知りたい値」の観測値。この値が、サンプルタイプ、処理タイプ(chiled or not)、concとどのような関係にあるかを調べたい
- 統計解析してみる
-
# このGLM()関数は、sasLMパッケージの関数
# CO2というデータフレームを使って
# uptakeがTypeとTreatmentとconcとを変数として線形回帰しているかどうかを調べる
# Type * Treatmentというのは、uptakeがTypeにも、Treatmentにも、TypeとTreatmentの組み合わせにも関係しているものとして線形回帰するつもりで解析する、という意味
# uptake = a1 Type + a2 Treatment + a3 (Type * Treatmen) + a4 conc + 乱雑項
# という式に当てはめて、よい感じのa1,a2,a3,a4を推定する
# そのうえで、その推定したa1,a2,a3,a4が本当に信じてよいかどうかをp値にして評価する
# その「統計学的検定手法」がANOVA
# p値が小さければa1,a2,a3,a4のそれぞれがを信じてよいと考える

GLM(uptake ~ Type*Treatment + conc, Data=CO2, lsm=TRUE)
# 出力
> GLM(uptake ~ Type*Treatment + conc, Data=CO2, lsm=TRUE)
# Pr(>F)がp値のこと。とても小さいので、線形回帰したモデルを全体として信じてよいということ
$ANOVA
Response : uptake
                Df Sum Sq Mean Sq F value    Pr(>F)
MODEL            4 6864.4 1716.09  47.693 < 2.2e-16 ***
RESIDUALS       79 2842.6   35.98
CORRECTED TOTAL 83 9707.0
---
Signif. codes:  0 ‘***’ 0.001 ‘**’ 0.01 ‘*’ 0.05 ‘.’ 0.1 ‘ ’ 1

# 調べた4つの項、Type, Treatment, TypeとTreatmentの組み合わせ項、concのすべてについてPr(>F) (p値のこと)が小さいので、すべての項目をそれぞれ信じてよいということ
# Type I , Type II, Type III というのは、一種の流儀の違いだが、ここではどれも同じ値を返しているので、区別を気にしなくてよい
$`Type I`
               Df Sum Sq Mean Sq F value    Pr(>F)
Type            1 3365.5  3365.5 93.5330 4.774e-15 ***
Treatment       1  988.1   988.1 27.4611 1.300e-06 ***
Type:Treatment  1  225.7   225.7  6.2733   0.01432 *
conc            1 2285.0  2285.0 63.5032 1.002e-11 ***
---
Signif. codes:  0 ‘***’ 0.001 ‘**’ 0.01 ‘*’ 0.05 ‘.’ 0.1 ‘ ’ 1

$`Type II`
               Df Sum Sq Mean Sq F value    Pr(>F)
Type            1 3365.5  3365.5 93.5330 4.774e-15 ***
Treatment       1  988.1   988.1 27.4611 1.300e-06 ***
Type:Treatment  1  225.7   225.7  6.2733   0.01432 *
conc            1 2285.0  2285.0 63.5032 1.002e-11 ***
---
Signif. codes:  0 ‘***’ 0.001 ‘**’ 0.01 ‘*’ 0.05 ‘.’ 0.1 ‘ ’ 1

$`Type III`
               Df Sum Sq Mean Sq F value    Pr(>F)
Type            1 3365.5  3365.5 93.5330 4.774e-15 ***
Treatment       1  988.1   988.1 27.4611 1.300e-06 ***
Type:Treatment  1  225.7   225.7  6.2733   0.01432 *
conc            1 2285.0  2285.0 63.5032 1.002e-11 ***
---
Signif. codes:  0 ‘***’ 0.001 ‘**’ 0.01 ‘*’ 0.05 ‘.’ 0.1 ‘ ’ 1

# ここは、「検定」の結果として、「信じてよい」ということが分かったので
# 以下の「推定」結果を信じましょう、その「推定結果a1,a2,a3,a4はこのくらいの値ですよ」という推定結果
# TypeがQuebecだと、Quebecの数が1,2,3と変わると、1増えるごとに、9.3810だけ、uptakeの値が大きくなる傾向があるよ、TypeがMississippiだとuptakeは増えないよ、という意味。
# nonchilledとchilledではnonchilledなら10.1381だけuptakeが増えるが、chilledだと増えないという意味
$Parameter
                                    Estimate Estimable Std. Error Df
(Intercept)                           8.1015         0    1.62794 79
TypeQuebec                            9.3810         0    1.85119 79
TypeMississippi                       0.0000         0    0.00000 79
Treatmentnonchilled                  10.1381         0    1.85119 79
Treatmentchilled                      0.0000         0    0.00000 79
TypeQuebec:Treatmentchilled           6.5571         0    2.61797 79
TypeQuebec:Treatmentnonchilled        0.0000         0    0.00000 79
TypeMississippi:Treatmentchilled      0.0000         0    0.00000 79
TypeMississippi:Treatmentnonchilled   0.0000         0    0.00000 79
conc                                  0.0177         1    0.00222 79
                                    t value  Pr(>|t|)
(Intercept)                          4.9765 3.709e-06 ***
TypeQuebec                           5.0675 2.590e-06 ***
TypeMississippi
Treatmentnonchilled                  5.4765 4.988e-07 ***
Treatmentchilled
TypeQuebec:Treatmentchilled          2.5047   0.01432 *
TypeQuebec:Treatmentnonchilled
TypeMississippi:Treatmentchilled
TypeMississippi:Treatmentnonchilled
conc                                 7.9689 1.002e-11 ***
---
Signif. codes:  0 ‘***’ 0.001 ‘**’ 0.01 ‘*’ 0.05 ‘.’ 0.1 ‘ ’ 1

$`Least Square Mean`
                                      LSmean  LowerCL  UpperCL        SE
(Intercept)                         27.21310 25.91036 28.51583 0.6544929
TypeQuebec                          33.54286 31.70051 35.38520 0.9255927
TypeMississippi                     20.88333 19.04099 22.72568 0.9255927
Treatmentnonchilled                 30.64286 28.80051 32.48520 0.9255927
Treatmentchilled                    23.78333 21.94099 25.62568 0.9255927
conc                                27.21310 25.91036 28.51583 0.6544929
TypeQuebec:Treatmentchilled         31.75238 29.14691 34.35785 1.3089858
TypeQuebec:Treatmentnonchilled      35.33333 32.72786 37.93880 1.3089858
TypeMississippi:Treatmentchilled    15.81429 13.20881 18.41976 1.3089858
TypeMississippi:Treatmentnonchilled 25.95238 23.34691 28.55785 1.3089858
                                    Df
(Intercept)                         79
TypeQuebec                          79
TypeMississippi                     79
Treatmentnonchilled                 79
Treatmentchilled                    79
conc                                79
TypeQuebec:Treatmentchilled         79
TypeQuebec:Treatmentnonchilled      79
TypeMississippi:Treatmentchilled    79
TypeMississippi:Treatmentnonchilled 79

> GLM(uptake ~ Type*Treatment + conc, Data=CO2, lsm=TRUE)
$ANOVA
Response : uptake
                Df Sum Sq Mean Sq F value    Pr(>F)
MODEL            4 6864.4 1716.09  47.693 < 2.2e-16 ***
RESIDUALS       79 2842.6   35.98
CORRECTED TOTAL 83 9707.0
---
Signif. codes:  0 ‘***’ 0.001 ‘**’ 0.01 ‘*’ 0.05 ‘.’ 0.1 ‘ ’ 1

$`Type I`
               Df Sum Sq Mean Sq F value    Pr(>F)
Type            1 3365.5  3365.5 93.5330 4.774e-15 ***
Treatment       1  988.1   988.1 27.4611 1.300e-06 ***
Type:Treatment  1  225.7   225.7  6.2733   0.01432 *
conc            1 2285.0  2285.0 63.5032 1.002e-11 ***
---
Signif. codes:  0 ‘***’ 0.001 ‘**’ 0.01 ‘*’ 0.05 ‘.’ 0.1 ‘ ’ 1

$`Type II`
               Df Sum Sq Mean Sq F value    Pr(>F)
Type            1 3365.5  3365.5 93.5330 4.774e-15 ***
Treatment       1  988.1   988.1 27.4611 1.300e-06 ***
Type:Treatment  1  225.7   225.7  6.2733   0.01432 *
conc            1 2285.0  2285.0 63.5032 1.002e-11 ***
---
Signif. codes:  0 ‘***’ 0.001 ‘**’ 0.01 ‘*’ 0.05 ‘.’ 0.1 ‘ ’ 1

$`Type III`
               Df Sum Sq Mean Sq F value    Pr(>F)
Type            1 3365.5  3365.5 93.5330 4.774e-15 ***
Treatment       1  988.1   988.1 27.4611 1.300e-06 ***
Type:Treatment  1  225.7   225.7  6.2733   0.01432 *
conc            1 2285.0  2285.0 63.5032 1.002e-11 ***
---
Signif. codes:  0 ‘***’ 0.001 ‘**’ 0.01 ‘*’ 0.05 ‘.’ 0.1 ‘ ’ 1

$Parameter
                                    Estimate Estimable Std. Error Df
(Intercept)                           8.1015         0    1.62794 79
TypeQuebec                            9.3810         0    1.85119 79
TypeMississippi                       0.0000         0    0.00000 79
Treatmentnonchilled                  10.1381         0    1.85119 79
Treatmentchilled                      0.0000         0    0.00000 79
TypeQuebec:Treatmentchilled           6.5571         0    2.61797 79
TypeQuebec:Treatmentnonchilled        0.0000         0    0.00000 79
TypeMississippi:Treatmentchilled      0.0000         0    0.00000 79
TypeMississippi:Treatmentnonchilled   0.0000         0    0.00000 79
conc                                  0.0177         1    0.00222 79
                                    t value  Pr(>|t|)
(Intercept)                          4.9765 3.709e-06 ***
TypeQuebec                           5.0675 2.590e-06 ***
TypeMississippi
Treatmentnonchilled                  5.4765 4.988e-07 ***
Treatmentchilled
TypeQuebec:Treatmentchilled          2.5047   0.01432 *
TypeQuebec:Treatmentnonchilled
TypeMississippi:Treatmentchilled
TypeMississippi:Treatmentnonchilled
conc                                 7.9689 1.002e-11 ***
---
Signif. codes:  0 ‘***’ 0.001 ‘**’ 0.01 ‘*’ 0.05 ‘.’ 0.1 ‘ ’ 1

$`Least Square Mean`
                                      LSmean  LowerCL  UpperCL        SE
(Intercept)                         27.21310 25.91036 28.51583 0.6544929
TypeQuebec                          33.54286 31.70051 35.38520 0.9255927
TypeMississippi                     20.88333 19.04099 22.72568 0.9255927
Treatmentnonchilled                 30.64286 28.80051 32.48520 0.9255927
Treatmentchilled                    23.78333 21.94099 25.62568 0.9255927
conc                                27.21310 25.91036 28.51583 0.6544929
TypeQuebec:Treatmentchilled         31.75238 29.14691 34.35785 1.3089858
TypeQuebec:Treatmentnonchilled      35.33333 32.72786 37.93880 1.3089858
TypeMississippi:Treatmentchilled    15.81429 13.20881 18.41976 1.3089858
TypeMississippi:Treatmentnonchilled 25.95238 23.34691 28.55785 1.3089858
                                    Df
(Intercept)                         79
TypeQuebec                          79
TypeMississippi                     79
Treatmentnonchilled                 79
Treatmentchilled                    79
conc                                79
TypeQuebec:Treatmentchilled         79
TypeQuebec:Treatmentnonchilled      79
TypeMississippi:Treatmentchilled    79
TypeMississippi:Treatmentnonchilled 79