ノンパラメトリック・ベイズ実践編
- Non-parametric bayesian clustering
- Data set simulation
n <- 1000
d <- 4
k <- 5
s <- sample(1:k,n,replace=TRUE)

m <- matrix(rnorm(d*k,sd=6),k,d)

X <- matrix(0,n,d)
for(i in 1:k){
  tmp <- which(s == i)
  r <- matrix(rnorm(d * length(tmp)))
  X[tmp,] <- r
  for(j in 1:d){
    X[tmp,j] <- X[tmp,j] + m[i,j]
  }
}
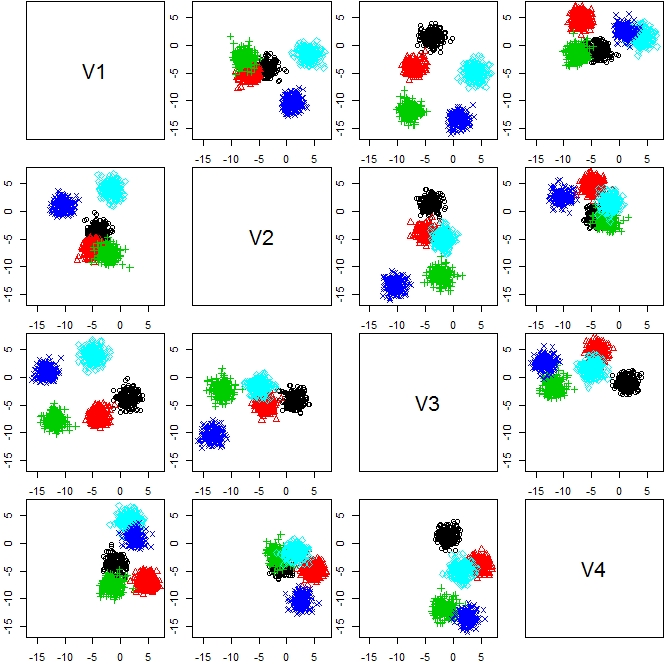
plot(as.data.frame(X))[f:id:ryamada22:20180922131657j:plain]

library(clues)
out <- clues(X)
plot(out)

machine-learning.hatenablog.com
を使っているらしく、速い!
# coding: utf-8

# In[1]:


# In[2]:


from sklearn.mixture import BayesianGaussianMixture
from sklearn.datasets import *
import numpy as np
import matplotlib.pyplot as plt
import seaborn as sns
import pandas as pd


# In[3]:


plt.style.use("seaborn")
np.random.seed(42)


# In[4]:


X,y = make_blobs(1000,n_features=4, centers = 5)


# In[13]:


dpgmm = BayesianGaussianMixture(n_components=1000)
dpgmm.fit(X)
y_pred = dpgmm.predict(X)


# In[14]:


X_df = pd.DataFrame(X,columns=["var1","var2","var3","var4",])
X_df["label"] = y
X_df["label"] = X_df["label"].astype("str")
X_df["prediction"] = y_pred
X_df["prediction"] = X_df["prediction"].astype("str")


# In[15]:


sns.pairplot(X_df, vars = ["var1","var2","var3","var4",],hue = "label")
plt.show()


# In[16]:


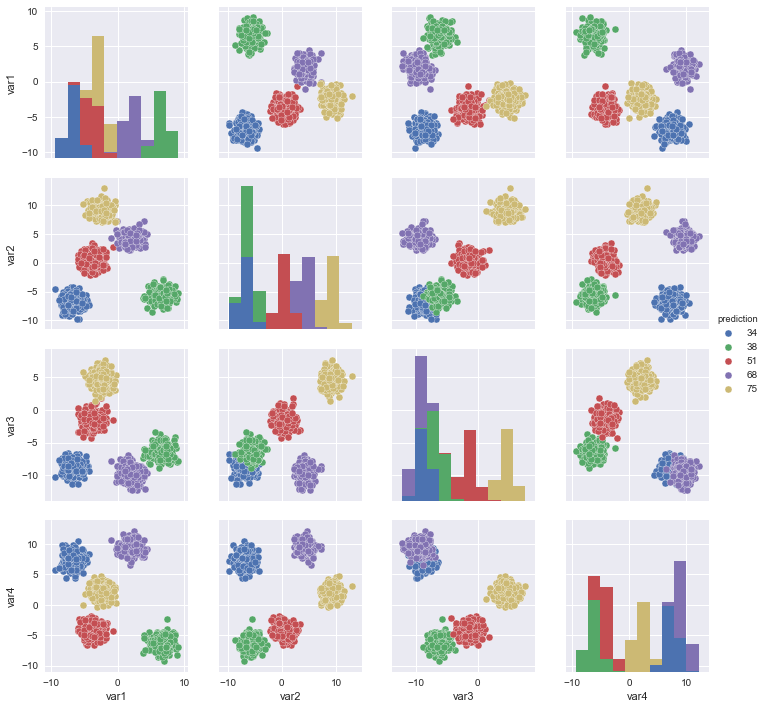
sns.pairplot(X_df, vars = ["var1","var2","var3","var4",],hue = "prediction")
plt.show()
install.packages("CRPClustering")
library(CRPClustering)
result <- crp_gibbs(as.matrix(X), mu=c(0,0,0,0), sigma_table=14, alpha
=0.3, ro_0 =0.1, burn_in=40, iteration =200)
crp_graph_2d(as.matrix(X), result)
- 出力
[1] "Center coordinates of Clusters"
  cluster     mu_k.1      mu_k.2       mu_k.3      mu_k.4
1      33 -1.7320941  -3.9238190  -0.02343495 -0.64889908
2       8 -5.4245621  -5.9558809  -2.48482642  4.09809942
3       5 -5.7573034  -1.9062441 -11.68433652 -0.60945428
4      44  1.8258171  -0.3260943  -0.48906236  1.01262547
5       9 -0.5258223 -11.0697677 -13.77974419  2.86106750
6      30 -4.2536066  -3.3689614   3.33196781 -2.17071835
7      29 -7.5764670  -3.0255271  -4.04623234  6.15198519
8      23  3.9127942  -1.5834261  -4.18575549  0.08683102
9      34 -2.9826239  -3.4543564   1.57405714 -1.00104252
[1] "The Number of Total Clusters  :  9"
[1] "Entropy All :  2.40723270175617"
[1] "z_result has numbers of clusters."
library(MASS)
dat <- rbind(mvrnorm(50, c(0,0), diag(c(1,1))),
       mvrnorm(50, c(2,2), diag(c(1,1))),
       mvrnorm(50, c(7,7), diag(c(1,1))),
       mvrnorm(50, c(8,9), diag(c(1,1))))

plot(dat,col=c(rep("red",50),rep("blue",50),rep("yellow",50),rep("black",50)))

result <- crp_gibbs(as.matrix(dat), mu=c(0,0), sigma_table=14, alpha =0.3, ro_0 =0.1, burn_in=40, iteration =200)
library(mclust)
Mclust(X) -> out
plot(out)
- 今日のまとめとして高次元データ用のクラスタリング法のレビューを読んでみる(こちら)
- parsimonious gaussian mixture model をRのpgmm パッケージでやってみる
- 階層的クラスタリングをしつつ、どこで切るのがよいか教えてくれる
> str(gaelle.bclust)
List of 14
 $ merge          : num [1:54, 1:2] -25 1 -12 -21 -8 5 2 4 -32 9 ...
 $ height         : num [1:54] 0 14.3 26 37.8 49.6 ...
 $ order          : num [1:55] 2 3 45 46 44 42 41 40 47 39 ...
 $ logposterior   : num [1:54] -2931 -2916 -2905 -2893 -2881 ...
 $ clust.number   : int [1:54] 54 53 52 51 50 49 48 47 46 45 ...
 $ cut            : num 741
 $ optim.alloc    : int [1:55] 1 1 1 2 2 2 2 2 2 2 ...
 $ optim.clustno  : int 7
 $ data           : num [1:55, 1:43] 0.33321 -0.00103 -0.2521 -0.17771 -0.43585 ...
  ..- attr(*, "dimnames")=List of 2
  .. ..$ : chr [1:55] "ColWT.1" "ColWT.3" "ColWT.2" "d172.1" ...
  .. ..$ : chr [1:43] "maltose.MX1" "L.ascorbic" "glutamic.3" "raffinose2" ...
 $ repno          : int [1:55] 1 1 1 1 1 1 1 1 1 1 ...
 $ transformed.par: num [1:6] -1.84 -0.99 1.63 0.08 -0.16 -1.68
 $ labels         : chr [1:55] "ColWT.1" "ColWT.3" "ColWT.2" "d172.1" ...
 $ effect.family  : chr "gaussian"
 $ var.select     : logi TRUE
 - attr(*, "class")= chr [1:2] "bclustvs" "hclust"