ウェーブレット変換〜WaveThreshパッケージを使ってみる

Wavelet Methods in Statistics with R (Use R!)
- 作者: Guy Nason
- 出版社/メーカー: Springer
- 発売日: 2008/08/11
- メディア: ペーパーバック
- クリック: 2回
- この商品を含むブログを見る
- 離散ウェーブレット。シグナルベクトルの長さは2のべき乗
library("WaveThresh")
y <- c(1,1,7,9,2,8,8,6)
# filter.numberとfamilyでHaarフィルタを指定している
ywd <- wd(y,filter.number=1,family="DaubExPhase")
name(ywd)
# フィルタとして使ったベクトル
ywd$filter
# 変換後
accessD(ywd,level=2)
# 2^kの長さのシグナルのとき、0,1,2,...,k段階のフィルタリングの結果が出る
plot(ywd)
ywd
- 段階ごとのフィルタベクトルを行列形で作って示す
W1 <-t(GenW(filter.number=1, family="DaubExPhase"))
W1
> ywd$filter
$H
[1] 0.7071068 0.7071068

$G
NULL

$name
[1] "Haar wavelet"

$family
[1] "DaubExPhase"

$filter.number
[1] 1

> accessD(ywd,level=2)
[1]   9.182828  -4.021581 -11.502039  -2.611543
> ywd
Class 'wd' : Discrete Wavelet Transform Object:
       ~~  : List with 8 components with names
              C D nlevels fl.dbase filter type bc date

$C and $D are LONG coefficient vectors

Created on : Thu Dec 12 09:50:29 2013
Type of decomposition:  wavelet

summary(.):
----------
Levels:  10
Length of original:  1024
Filter was:  Haar wavelet
Boundary handling:  periodic
Transform type:  wavelet
Date:  Thu Dec 12 09:50:29 2013
> W1
          [,1]       [,2]       [,3]       [,4]       [,5]       [,6]
[1,] 0.3535534  0.3535534  0.3535534  0.3535534  0.3535534  0.3535534
[2,] 0.7071068 -0.7071068  0.0000000  0.0000000  0.0000000  0.0000000
[3,] 0.0000000  0.0000000  0.7071068 -0.7071068  0.0000000  0.0000000
[4,] 0.0000000  0.0000000  0.0000000  0.0000000  0.7071068 -0.7071068
[5,] 0.0000000  0.0000000  0.0000000  0.0000000  0.0000000  0.0000000
[6,] 0.5000000  0.5000000 -0.5000000 -0.5000000  0.0000000  0.0000000
[7,] 0.0000000  0.0000000  0.0000000  0.0000000  0.5000000  0.5000000
[8,] 0.3535534  0.3535534  0.3535534  0.3535534 -0.3535534 -0.3535534
           [,7]       [,8]
[1,]  0.3535534  0.3535534
[2,]  0.0000000  0.0000000
[3,]  0.0000000  0.0000000
[4,]  0.0000000  0.0000000
[5,]  0.7071068 -0.7071068
[6,]  0.0000000  0.0000000
[7,] -0.5000000 -0.5000000
[8,] -0.3535534 -0.3535534
- フィルタがorthogonalであるとは、転置行列を掛けて単位行列ができること
W1 %*% t (W1)
- 別のfamilyで作ったフィルタでも同じ
W1 <-t(GenW(filter.number=10, family="DaubLeAsymm"))
round(W1,5)
round(W1 %*% t (W1),5)
> round(W1,5)
         [,1]     [,2]     [,3]     [,4]     [,5]     [,6]     [,7]
[1,]  0.35355  0.35355  0.35355  0.35355  0.35355  0.35355  0.35355
[2,]  0.77420 -0.47166 -0.09124  0.15373  0.06160 -0.01394 -0.03746
[3,] -0.03746 -0.37524  0.77420 -0.47166 -0.09124  0.15373  0.06160
[4,]  0.06160 -0.01394 -0.03746 -0.37524  0.77420 -0.47166 -0.09124
[5,] -0.09124  0.15373  0.06160 -0.01394 -0.03746 -0.37524  0.77420
[6,]  0.38395  0.69175  0.10129 -0.40916 -0.19721 -0.00975 -0.28803
[7,] -0.19721 -0.00975 -0.28803 -0.27284  0.38395  0.69175  0.10129
[8,] -0.27529  0.09639  0.41094  0.49603  0.27529 -0.09639 -0.41094
         [,8]
[1,]  0.35355
[2,] -0.37524
[3,] -0.01394
[4,]  0.15373
[5,] -0.47166
[6,] -0.27284
[7,] -0.40916
[8,] -0.49603
> round(W1 %*% t (W1),5)
     [,1] [,2] [,3] [,4] [,5] [,6] [,7] [,8]
[1,]    1    0    0    0    0    0    0    0
[2,]    0    1    0    0    0    0    0    0
[3,]    0    0    1    0    0    0    0    0
[4,]    0    0    0    1    0    0    0    0
[5,]    0    0    0    0    1    0    0    0
[6,]    0    0    0    0    0    1    0    0
[7,]    0    0    0    0    0    0    1    0
[8,]    0    0    0    0    0    0    0    1
- 試してみよう
yy <- DJ.EX()$blocks
yywd <- wd(yy, filter.number=1, family="DaubExPhase")
x <- 1: 1024
oldpar <- par(mfrow=c(2,2))
plot(x, yy, type="l", xlab="x", ylab="Blocks")
plot(x, yy, type="l", xlab="x", ylab="Blocks")
plot (yywd, main="")
plot(yywd,scaling="by.level", main="")
par(oldpar)
yy <- DJ.EX()$doppler
yywd <- wd(yy, filter.number=1, family="DaubExPhase")
x <- 1: 1024
oldpar <- par(mfrow=c(2,2))
plot(x, yy, type="l", xlab="x", ylab="Doppler")
plot(x, yy, type="l", xlab="x", ylab="Doppler")
plot (yywd, main="")
plot(yywd,scaling="by.level", main="")
par(oldpar)
- ウェーブレット変換がうまく行っているのは、いろいろな直交関数系が整備されたから、とか、特定のモーメントを排除した関数を用いて関数系が整備されたから、とか、そんなことが背景としてある。そんなウェーブレットたちをfamilyとfilter.numberで指定して、その形をぱぱっと描けるようにWaveThreshパッケージには関数がある
oldpar<-par(mfrow=c(2,1))
draw.default(filter.number=4, family="DaubExPhase", enhance=FALSE, main="a.")
draw.default(filter.number=4, family="DaubExPhase", enhance=FALSE, scaling.function=TRUE, main="b.")
par(oldpar)
- こんなフィルタも
par(mfcol=c(1,1))
filter.select(filter.number=2, family="DaubExPhase")
draw.default (filter.number=2, family="DaubExPhase",scaling.function=TRUE)
> filter.select(filter.number=2, family="DaubExPhase")
$H
[1]  0.4829629  0.8365163  0.2241439 -0.1294095

$G
NULL

$name
[1] "Daub cmpct on ext. phase N=2"

$family
[1] "DaubExPhase"

$filter.number
[1] 2
- 変換して、逆変換する
y <- c(1,1,7,9,2,8,8,6)
ywd <- wd(y,filter.number=1,family="DaubExPhase")
yinv <- wr(ywd)
yinv
> yinv
[1] 1 1 7 9 2 8 8 6
- Non-deicmated DWTとConventional DWTはdw()のtypeオプションで使い分ける
- " "wavelet" (default) in which case the standard DWT is performed (as in previous releases of WaveThresh). If type is "station" then the non-decimated DWT is performed."
ywd <- wd(y,filter.number=1,family="DaubExPhase")
ywdS <- wd(y, filter.number=1, family="DaubExPhase", type="station")
ywst <- wst(y, filter.number=1, family="DaubExPhase")
accessD(ywd, level=2)
accessD(ywdS, level=2)
accessD(ywst, level=2)
> accessD(ywd, level=2)
[1]  0.000000 -1.414214 -4.242641  1.414214
> accessD(ywdS, level=2)
[1]  0.000000 -4.242641 -1.414214  4.949747 -4.242641  0.000000  1.414214
[8]  3.535534
> accessD(ywst, level=2)
[1]  0.000000 -1.414214 -4.242641  1.414214 -4.242641  4.949747  0.000000
[8]  3.535534
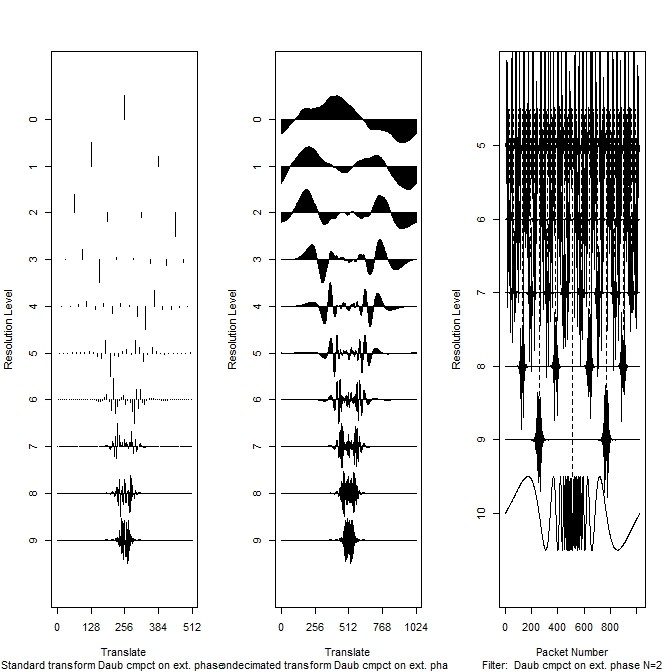
- 3方法で比較
- 1つ目と2つ目は前者がデフォルトで、後者がnon-decimates DWT
- 3つ目はpacket-ordered(階層的分解のこと(らしい))
y <- simchirp()
ywd <- wd(y$y, filter.number=2, family= "DaubExPhase")
par(mfcol=c(1,3))
plot(ywd, scaling="by.level" , main="")
ywd <- wd(y$y, filter.number=2, family="DaubExPhase" ,type="station")
plot(ywd, scaling="by.level" , main="")
ywst <- wst(y$y, filter.number=2, family="DaubExPhase")
plot (ywst, scaling="by .level", main="")
par(mfcol=c(1,1))
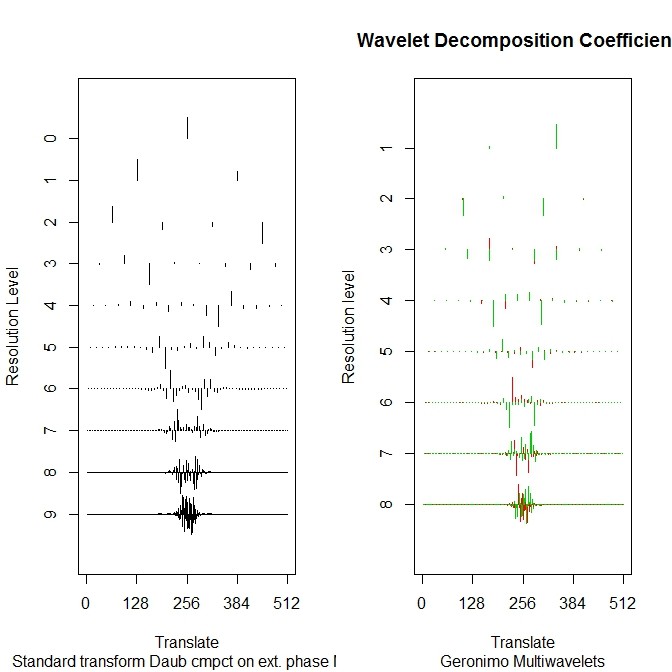
- 複数のウェーブレットでやることもある
par(mfcol=c(1,2))
ymwd <- mwd(y$y)
ywd <- wd(y$y, filter.number=2, family= "DaubExPhase")
plot(ywd, scaling="by.level" , main="")
plot (ymwd, cex=1)
par(mfcol=c(1,1))
- 変換して圧縮した後、それがよいのかどうかの判断基準が要るが、それに情報エントロピーを使うようだ
v1 <- c(0,0,1)
Shannon.entropy(v1)
v2 <- rep(1/sqrt(3), 3)
Shannon.entropy(v2)
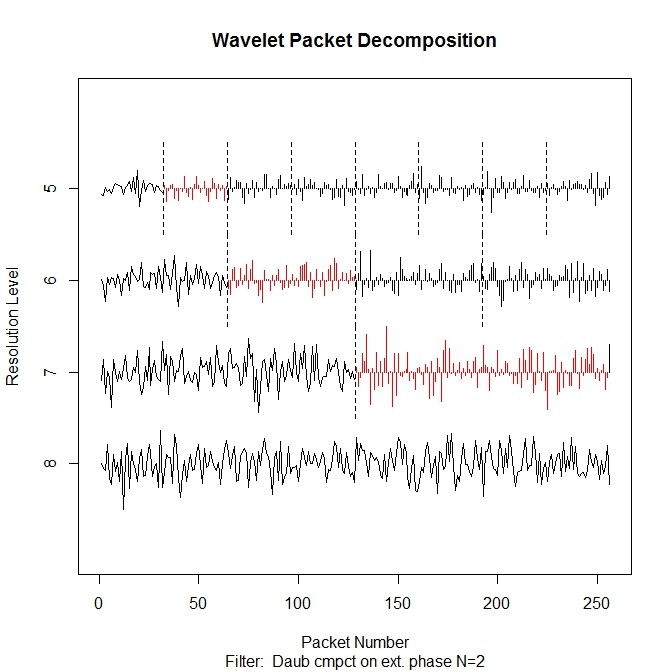
- パケット変換する
z <- rnorm(256)
zwp <- wp(z, filter.number=2, family="DaubExPhase")
plot(zwp, color.force=TRUE)
- 2次元変換
data(teddy)
greycol <- grey((0:255)/255)
teddyimwd <- imwd(teddy, filter.number=10)
myt <- function(x) 20+sqrt(x)
plot (teddyimwd, col=greycol, transform=TRUE, tfunction=myt)
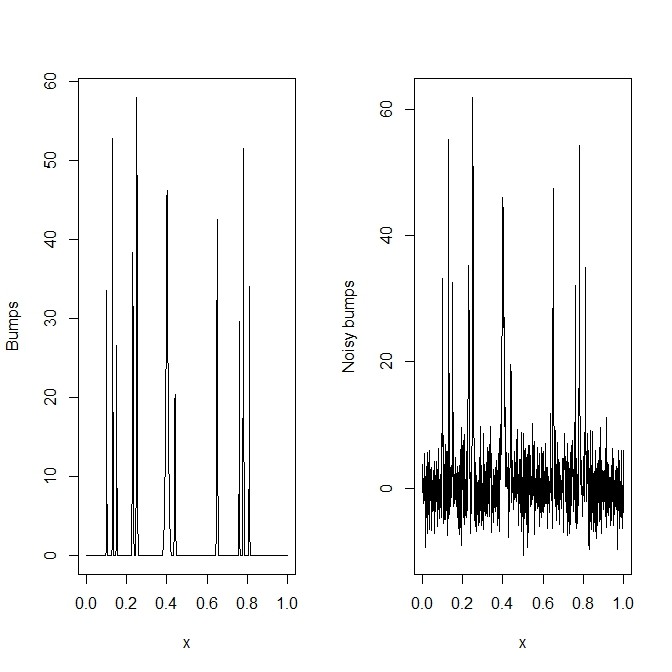
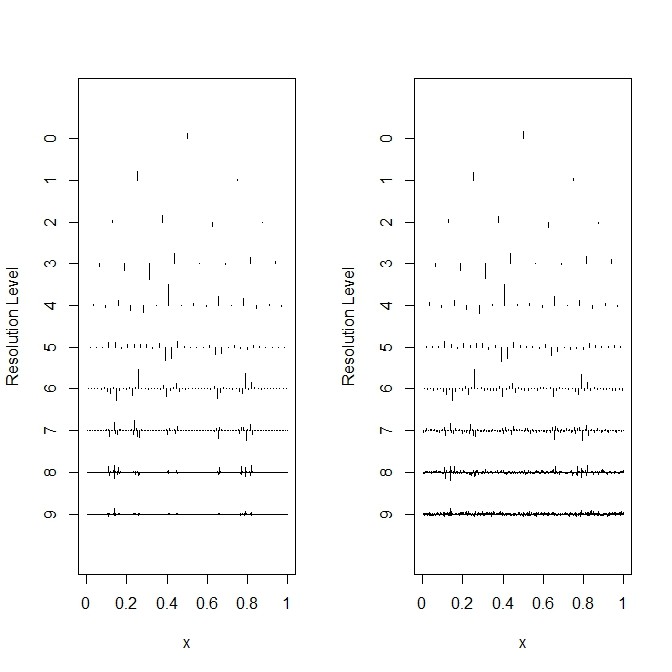
- 規則性はないが、大きい真のシグナルと、そこに入ったノイズとからなるデータに対してウェーブレット変換してみる。真のシグナルだけのデータに対して行う変換と、ノイズ入りデータに対して行う変換とでは、「粗大」なスペクトルはほぼ同じで、小さいところだけが違うことが見て取れる
v <- DJ.EX()
x <- (1:1024)/1024
par(mfcol=c(1,2))
plot(x, v$bumps, type="l", ylab="Bumps")
ssig <- sd(v$bumps)
SNR <- 2
sigma <- ssig/SNR
e <- rnorm(1024, mean=0, sd=sigma)
y <- v$bumps + e
plot(x, y, type="l", ylab="Noisy bumps")
par(mfcol=c(1,1))
-
- こんなデータ(ノイズなしとあり)
- 変換
xlv <- seq(from=0, to=1.0, by=0.2)
bumpswd <- wd(v$bumps)
par(mfcol=c(1,2))
plot(bumpswd, main="", sub="" , xlabvals=xlv*512, xlabchars=as.character(xlv) , xlab="x")

ywd <- wd(y)
plot (ywd, main="", sub="" , xlabvals=xlv*512, xlabchars=as.character(xlv) , xlab="x")
par(mfcol=c(1,1))
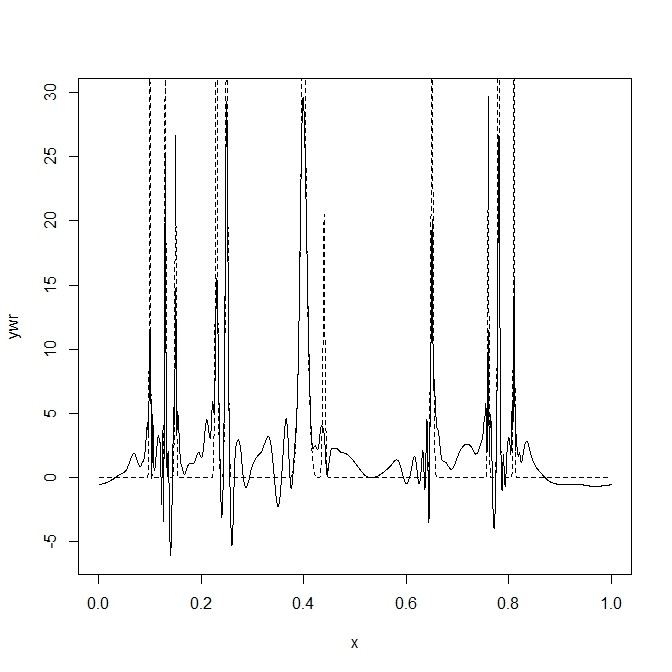
- 使うレベルをlevオプションで指定しながら、部分情報で再構成
FineCoefs <- accessD(ywd, lev=ywd$nlevels-1)
sigma <- mad(FineCoefs)
utDJ <- sigma*sqrt(2*log(1024))
ywdT <- threshold(ywd, policy="manual" , value=utDJ)
ywr <- wr(ywdT)
plot(x, ywr, type="l")
lines(x, v$bumps, lty=2)


