- 単調増加の検出と比較の目次
- さて、実際にRに実装されているパッケージ・関数でやってみよう
- 最小化されるべき関数を
 とする
とする
- 制約は、
 に関する等式と不等式とで表される
- 等式で表される制約meと不等式で表される制約mとがあって、併せてM=me+mとする
- 今回の例では、me=0
- 変数n、制約の個数M=mについて、M x n 行列 Amat2があって、
 が制約となる
- 以降で用いるquadprogパッケージのsolve.QP()関数の場合には、等式制約と不等式制約とを両方合わせて M x n 行列にしたうえで、どれが等式制約でどれが不等式制約であるのかをプログラムに引数指定する仕組みを取っている
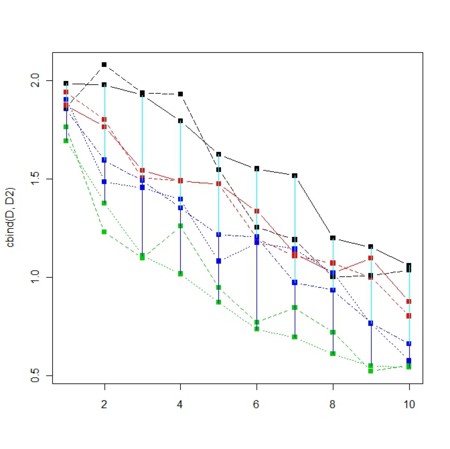
- データを作って
library(IsoGene)
library(quadprog)
N<-10
M<-4
D<-matrix(0,N,M)
D[,1]<-sort(runif(N),decreasing=TRUE)+1
for(i in 2:M){
k<-0.2
D[1,i]<-D[1,1]*(runif(1)*k+(1-k))
for(j in 2:N){
D[j,i]<-min(D[j-1,i],D[j,1])*(runif(1)*k+(1-k))
}
}
r<-0.3
D2<-D+rnorm(N*M,sd=sqrt(var(D))*r)

matplot(cbind(D,D2),type="b",pch=15,col=c(rep(1:M,2)))
for(i in 1:N){
for(j in 2:M){
segments(i,D[i,1],i,D[i,j],col=1+j)
}
}
- Dmatはnxn正方行列で、今回の場合、
 はiによらず一定なので
ws<-rep(3,N*M)
Dmat<-diag(ws)
- dvecの方がデータを反映する。きれいなデータとばらつかせたデータで異なるdvec
dvec<-ws*c(D)
dvec2<-ws*c(D2)
Q<-NULL
for(j in 1:M){
for(i in 1:(N-1)){
st<-(j-1)*N + i
end<-st+1
tmp<-rep(0,N*M)
tmp[st]<-1
tmp[end]<--1
Q<-rbind(Q,tmp)
}
}
for(i in 2:M){
for(j in 1:N){
st<-j
end<-N*(i-1)+j
tmp<-rep(0,N*M)
tmp[st]<-1
tmp[end]<--1
Q<-rbind(Q,tmp)
}
}
Q
Amat2<-Q
Amat<-t(Amat2)
bvec<-rep(0,length(Amat[1,]))
out1<-solve.QP(Dmat,dvec,Amat,bvec=bvec,meq=0)
out2<-solve.QP(Dmat,dvec2,Amat,bvec=bvec,meq=0)
> out1
$solution
 [1] 1.7606338 1.5881934 1.5344888 1.4592201 1.3439146 1.2502945 1.1429360 1.0838089 1.0694384 1.0424076
[11] 1.7213358 1.5009083 1.4585956 1.4119514 1.1144510 0.9078028 0.7854388 0.6350420 0.6181277 0.6076870
[21] 1.4162341 1.2329624 1.1962830 1.1570695 1.0061177 0.8408625 0.8052883 0.6720841 0.5707691 0.4617527
[31] 1.4228720 1.2459309 1.1158810 1.0977527 0.9282307 0.8692899 0.7723391 0.7202274 0.5788950 0.4863466

$value
[1] -25.17345

$unconstrained.solution
 [1] 1.7606338 1.5881934 1.5344888 1.4592201 1.3439146 1.2502945 1.1429360 1.0838089 1.0694384 1.0424076
[11] 1.7213358 1.5009083 1.4585956 1.4119514 1.1144510 0.9078028 0.7854388 0.6350420 0.6181277 0.6076870
[21] 1.4162341 1.2329624 1.1962830 1.1570695 1.0061177 0.8408625 0.8052883 0.6720841 0.5707691 0.4617527
[31] 1.4228720 1.2459309 1.1158810 1.0977527 0.9282307 0.8692899 0.7723391 0.7202274 0.5788950 0.4863466

$iterations
[1] 1 0

$Lagrangian
 [1] 0 0 0 0 0 0 0 0 0 0 0 0 0 0 0 0 0 0 0 0 0 0 0 0 0 0 0 0 0 0 0 0 0 0 0 0 0 0 0 0 0 0 0 0 0 0 0 0 0 0 0
[52] 0 0 0 0 0 0 0 0 0 0 0 0 0 0 0

$iact
[1] 0

>
> out2
$solution
 [1] 1.8479498 1.5062915 1.5062915 1.4910746 1.3453317 1.1982639 1.0845460 1.0845460 1.0845460 1.0845460
[11] 1.7073539 1.5062915 1.5062915 1.4519923 0.9273577 0.9273577 0.7169679 0.7169679 0.6646322 0.6646322
[21] 1.2745786 1.2606716 1.2606716 1.2606716 0.9175620 0.9175620 0.9175620 0.6482105 0.6482105 0.6482105
[31] 1.2877883 1.1185829 1.0685545 0.9041312 0.8946122 0.8946122 0.7074181 0.7074181 0.5164071 0.4327213

$value
[1] -24.71127

$unconstrained.solution
 [1] 1.8479498 1.4801033 1.4579306 1.4910746 1.3453317 1.1982639 1.0813759 1.0341926 0.9415810 1.2810346
[11] 1.7073539 1.5149246 1.5722076 1.4519923 0.8326514 1.0220641 0.7111795 0.7227562 0.6261859 0.7030785
[21] 1.2745786 1.1908582 1.2852327 1.3059240 0.8881577 0.9410679 0.9234605 0.6031618 0.6830170 0.6584525
[31] 1.2877883 1.1185829 1.0685545 0.9041312 0.8199964 0.9692281 0.6990717 0.7157646 0.5164071 0.4327213

$iterations
[1] 18  0

$Lagrangian
 [1] 0.000000000 0.017555148 0.000000000 0.000000000 0.000000000 0.000000000 0.003170138 0.053523534
 [9] 0.196488559 0.000000000 0.000000000 0.000000000 0.000000000 0.094706353 0.000000000 0.005788359
[17] 0.000000000 0.038446317 0.000000000 0.069813443 0.045252374 0.000000000 0.029404307 0.005898483
[25] 0.000000000 0.045048638 0.010242070 0.000000000 0.000000000 0.000000000 0.000000000 0.074615838
[33] 0.000000000 0.008346482 0.000000000 0.000000000 0.000000000 0.008633070 0.065916062 0.000000000
[41] 0.000000000 0.000000000 0.000000000 0.000000000 0.000000000 0.000000000 0.000000000 0.000000000
[49] 0.000000000 0.000000000 0.000000000 0.000000000 0.000000000 0.000000000 0.000000000 0.000000000
[57] 0.000000000 0.000000000 0.000000000 0.000000000 0.000000000 0.000000000 0.000000000 0.000000000
[65] 0.000000000 0.000000000

$iact
 [1]  9 14 32 39 20 26  8 18 21 23  2 34 27 16 38 24  7
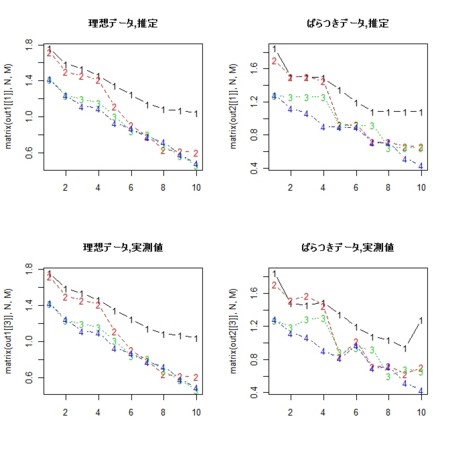
- それをプロット(ばらつきを入れる前のデータと入れた後のデータのそれぞれについて、推測グラフと実測値グラフ)

par(mfcol=c(2,2))

matplot(matrix(out1[[1]],N,M),type="b",main="理想データ,推定")
matplot(matrix(out1[[3]],N,M),type="b",main="理想データ,実測値")

matplot(matrix(out2[[1]],N,M),type="b",main="ばらつきデータ,推定")

matplot(matrix(out2[[3]],N,M),type="b",main="ばらつきデータ,実測値")

par(mfcol=c(1,1))
matplot(cbind(out1$unconstrained.solution,out1$solution),type="b",pch=15,col=c(rep(1:M,2)))
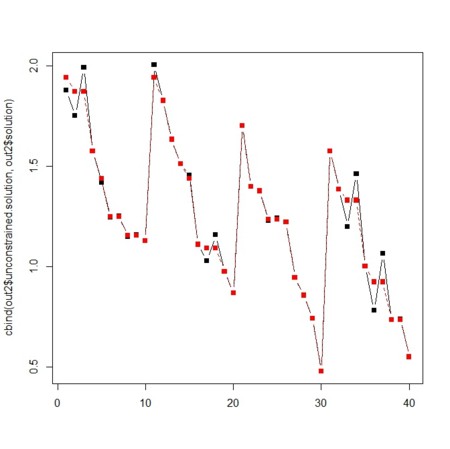
matplot(cbind(out2$unconstrained.solution,out2$solution),type="b",pch=15,col=c(rep(1:M,2)))

とする
に関する等式と不等式とで表される
が制約となる
はiによらず一定なので


