- 異なる観察時刻を扱うために、補間した(こちら)
- 時系列データの異同を相関関数で評価した(こちら)
- 因果関係を考えるときには、観察値の微分・積分を考慮することもあることも考えた(こちら)
- いわゆる臨床時系列データをシミュレーションした(こちら)
- これらを併せてみよう


my.diff<-function(time,value){
ord<-order(time)
diff.t<-diff(time[ord])
diff.v<-diff(value[ord])
tmp.value<-diff.v/diff.t
tmp.time<-(time[ord])[1:(length(time)-1)] + diff.t/2
return(list(time=tmp.time,value=tmp.value))
}
my.integral<-function(time,value){
ord<-order(time)
cum.v<-c(0,cumsum(value[ord]))
diff.t<-diff(time[ord])
cum.t<-c(time[ord][1]-diff.t[1]/2,(time[ord])[1:(length(time)-1)]+diff.t/2,time[ord][length(time)]+diff.t[length(diff.t)]/2)
return(list(time=cum.t,value=cum.v))
}
library(pracma)
myModify<-function(time,value,d,method="linear"){
if(d==0){
return(list(time=time,value=value))
}else if (d==1){
Range<-range(time)
intvl<-min(diff(sort(unique(time))))
wt<-seq(from=Range[1],to=Range[2],by=intvl)
tmp<-interp1(time,value,wt,method=method)
return(my.diff(wt,tmp))
}else if (d==-1){
Range<-range(time)
intvl<-min(diff(sort(unique(time))))
wt<-seq(from=Range[1],to=Range[2],by=intvl)
tmp<-interp1(time,value,wt,method=method)
return(my.integral(wt,tmp))
}
}
MakeWt<-function(time1,time2){
RangeWt<-range(time1)
RangeWt[1]<-max(RangeWt[1],min(time2))
RangeWt[2]<-min(RangeWt[2],max(time2))
seq(from=RangeWt[1],to=RangeWt[2],by=min(diff(sort(unique(c(time1,time2))))))
}
myCalcStat2<-function(X1,X2,wt,method="linear"){
Y1<-interp1(X1$time,X1$value,wt,method=method)
Y2<-interp1(X2$time,X2$value,wt,method=method)
ret<-anova(lm(Y1~Y2)[[5]][1])
if(is.na(ret)){
ret<-1
}
ret
}
my.TimeCorr<-function(T1,T2,di1=0,di2=0,method="linear",perm=TRUE,niter=1000){
mT1<-myModify(T1$time,T1$value,d=di1,method=method)
mT2<-myModify(T2$time,T2$value,d=di2,method=method)
wt<-MakeWt(mT1$time,mT2$time)
stat.ori<-myCalcStat2(mT1,mT2,wt,method=method)
if(!perm){
stat.perm<-NULL
perm.p<-NULL
}else{
stat.perm<-rep(0,niter)
for(i in 1:niter){
sh<-list(time=T1$time,value=T1$value[sample(1:length(T1$value))])
mT1sh<-myModify(sh$time,sh$value,d=di1,method=method)
stat.perm[i]<-myCalcStat2(mT1sh,mT2,wt,method=method)
}
perm.p<-length(which(stat.perm>stat.ori))/niter
}
list(mT1=mT1,mT2=mT2,wt=wt,stat.ori=stat.ori,stat.perm=stat.perm,perm.p=perm.p)
}
myCalcStat<-function(X1,X2,wt,method="linear"){
Y1<-interp1(X1$time,X1$value,wt,method=method)
Y2<-interp1(X2$time,X2$value,wt,method=method)
sum(Y1*Y2)
}
my.TimeCorr<-function(T1,T2,di1=0,di2=0,method="linear",perm=TRUE,niter=1000){
mT1<-myModify(T1$time,T1$value,d=di1,method=method)
mT2<-myModify(T2$time,T2$value,d=di2,method=method)
wt<-MakeWt(mT1$time,mT2$time)
stat.ori<-myCalcStat(mT1,mT2,wt,method=method)
if(!perm){
stat.perm<-NULL
perm.p<-NULL
}else{
stat.perm<-rep(0,niter)
for(i in 1:niter){
sh<-list(time=T1$time,value=T1$value[sample(1:length(T1$value))])
mT1sh<-myModify(sh$time,sh$value,d=di1,method=method)
stat.perm[i]<-myCalcStat(mT1sh,mT2,wt,method=method)
}
perm.p<-length(which(stat.perm>stat.ori))/niter
}
list(mT1=mT1,mT2=mT2,wt=wt,stat.ori=stat.ori,stat.perm=stat.perm,perm.p=perm.p)
}
library(MCMCpack)
Tmax<-100
Tlen<-2000
T<-seq(from=0,to=Tmax,length=Tlen)
Nsample<-5
VtParam<-sample(10:20,Nsample,replace=TRUE)
Disease<-function(ID=1,T,Tmax,Tlen,VtParam){
V<-runif(Tlen)
Vnatural<-cumsum(V)
Vt<-150-(rnorm(Tlen))*50
Vperiod<-100
r<-0.95
Vintervention<-rep(0,Tlen)
Vintervention[1]<-V[1]
Intervention<-rep(0,Tlen)
for(i in 2:Tlen){
if(max(Vintervention[max(1,i-Vperiod-1):(i-1)]-Vt[max(1,i-Vperiod-1):(i-1)])>0){
Vintervention[i]<-Vintervention[i-1]*r+V[i]
Intervention[i]<-1
}else{
Vintervention[i]<-Vintervention[i-1]+V[i]
}
}
Ct<-30
tmp<-Vintervention
tmp[tmp<Ct]<-0
tmp[tmp>=Ct]<-runif(1)
Cumul<-cumsum(tmp)
CumulSt<-Cumul/max(Cumul)
VinterventionSt<-Vintervention/max(Vintervention)
Tst<-T/max(T)
X<-cbind(rep(ID,Tlen),CumulSt,VinterventionSt,Intervention,Tst)
X
}
Out<-list()
for(i in 1:Nsample){
Out[[i]]<-Disease(ID=i,T,Tmax,Tlen,VtParam[i])
}
Out2<-NULL
for(i in 1:Nsample){
tmp<-Out[[i]][sample(1:length(Out[[i]][,1]),length(Out[[i]][,1])/100),]
print(tmp)
Out2<-rbind(Out2,tmp)
}
matplot(Out2,type="l",ylim=c(0,1))
pairs(Out2)
plot(Out2[1:(length(Out2[,1])-1),4],diff(Out2[,2]))
t.test(Out2[1:(length(Out2[,1])-1),4],diff(Out2[,2]))
library(lme4)
library(SASmixed)
(fm1<-lmer(diff(Out2[,2])~ Out2[1:(length(Out2[,1])-1),1] +(Out2[1:(length(Out2[,1])-1),4] | Out2[1:(length(Out2[,1])-1),1])))
anova(fm1)
V<-runif(Tlen)
Vnatural<-cumsum(V)
Vt<-150-(rnorm(Tlen))*50
Vperiod<-100
r<-0.95
Vintervention<-rep(0,Tlen)
Vintervention[1]<-V[1]
Intervention<-rep(0,Tlen)
for(i in 2:Tlen){
if(max(Vintervention[max(1,i-Vperiod-1):(i-1)]-Vt[max(1,i-Vperiod-1):(i-1)])){
Vintervention[i]<-Vintervention[i-1]*r+V[i]
Intervention[i]<-1
}else{
Vintervention[i]<-Vintervention[i-1]+V[i]
}
}
Ct<-30
tmp<-Vintervention
tmp[tmp<Ct]<-0
tmp[tmp>=Ct]<-runif(1)
Cumul<-cumsum(tmp)
CumulSt<-Cumul/max(Cumul)
VinterventionSt<-Vintervention/max(Vintervention)
Tst<-T/max(T)
X<-cbind(CumulSt,VinterventionSt,Intervention,Tst)
V<-runif(Tlen)
Vnatural<-cumsum(V)
Vt<-150-(rnorm(Tlen))*50
Vperiod<-100
r<-0.95
Vintervention<-rep(0,Tlen)
Vintervention[1]<-V[1]
Intervention<-rep(0,Tlen)
for(i in 2:Tlen){
if(max(Vintervention[max(1,i-Vperiod-1):(i-1)]-Vt[max(1,i-Vperiod-1):(i-1)])>0){
Vintervention[i]<-Vintervention[i-1]*r+V[i]
Intervention[i]<-1
}else{
Vintervention[i]<-Vintervention[i-1]+V[i]
}
}
Ct<-30
tmp<-Vintervention
tmp[tmp<Ct]<-0
tmp[tmp>=Ct]<-runif(1)
Cumul<-cumsum(tmp)
CumulSt<-Cumul/max(Cumul)
VinterventionSt<-Vintervention/max(Vintervention)
Tst<-T/max(T)
X<-cbind(CumulSt,VinterventionSt,Intervention,Tst)
matplot(X,type="l")
VTlist<-list()
n.t.list<-c(25,30,28)
tselected<-sort(sample(1:length(Tst),n.t.list[1]))
VTlist[[1]]<-cbind(CumulSt[tselected],Tst[tselected])
tselected<-sort(sample(1:length(Tst),n.t.list[2]))
VTlist[[2]]<-cbind(VinterventionSt[tselected],Tst[tselected])
tselected<-sort(sample(1:length(Tst),n.t.list[3]))
VTlist[[3]]<-cbind(Intervention[tselected],Tst[tselected])
diff1<-my.diff(VTlist[[1]][,2],VTlist[[1]][,1])
VTlist[[4]]<-cbind(diff1[[2]]/max(diff1[[2]]),diff1[[1]])
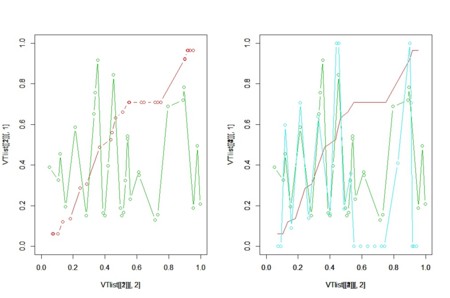
par(mfcol=c(1,2))
xlim<-range(Tst)
ylim<-range(X)
plot(VTlist[[1]][,2],VTlist[[1]][,1],xlim=xlim,ylim=ylim,type="b",col=2)
par(new=TRUE)
plot(VTlist[[2]][,2],VTlist[[2]][,1],xlim=xlim,ylim=ylim,type="b",col=3)
plot(VTlist[[1]][,2],VTlist[[1]][,1],xlim=xlim,ylim=ylim,type="l",col=2)
par(new=TRUE)
plot(VTlist[[2]][,2],VTlist[[2]][,1],xlim=xlim,ylim=ylim,type="b",col=3)
par(new=TRUE)
plot(VTlist[[4]][,2],VTlist[[4]][,1],xlim=xlim,ylim=ylim,type="b",col=5)
par(mfcol=c(1,1))
vt1<-VTlist[[2]]
vt2<-VTlist[[4]]
xlim<-range(c(vt1[,2],vt2[,2]))
ylim<-range(c(vt1[,1],vt2[,2]))
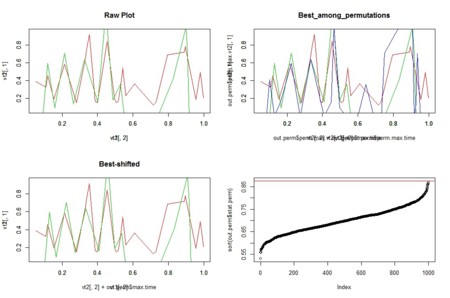
out.perm<-corr.fx(vt1,vt2,permutation=TRUE,n.perm=1000)
par(mfcol=c(2,2))
plot(vt1[,2],vt1[,1],type="l",col=2,xlim=xlim,ylim=ylim,main="Raw Plot")
par(new=TRUE)
plot(vt2[,2],vt2[,1],type="l",col=3,xlim=xlim,ylim=ylim)
plot(vt1[,2],vt1[,1],type="l",col=2,xlim=xlim,ylim=ylim,main="Best-shifted")
par(new=TRUE)
plot(vt2[,2]+out.perm$max.time,vt2[,1],type="l",col=3,xlim=xlim,ylim=ylim)
plot(vt1[,2],vt1[,1],type="l",col=2,xlim=xlim,ylim=ylim,main="Best_among_permutations")
par(new=TRUE)
plot(vt2[,2]+out.perm$max.time,vt2[,1],type="l",col=3,xlim=xlim,ylim=ylim)
par(new=TRUE)
plot(out.perm$perm.max.vt2[,2]+out.perm$perm.max.time,out.perm$perm.max.vt2[,1],type="l",col=4,xlim=xlim,ylim=ylim)
plot(sort(out.perm$stat.perm),ylim=range(c(out.perm$stat.perm,out.perm$corr)))
abline(h=out.perm$corr,col=2,main="Distribution_of_stats")
par(mfcol=c(1,1))

