- 前の記事からの続き
- 複数の候補はある尺度に関して順序をつけることができるとする
- そして選挙権者は候補者に対する好悪の程度がこの尺度上での距離によって決まるものとする
- このとき、どんな変化になるだろうか
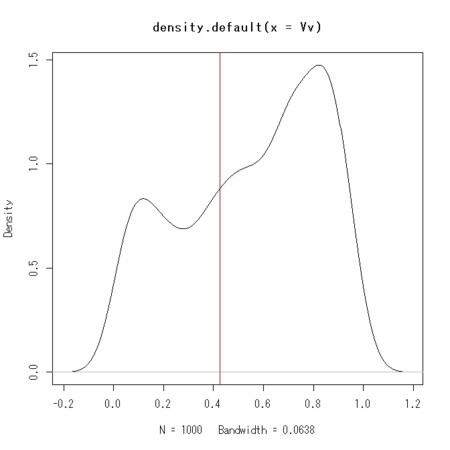
- 選挙権者の意見の分布を描き、当選者の意見の位置を赤で示した

Nv <- 1000
Nc <- 100
Cv <- c(rbeta(Nc/2,1,3), rbeta(Nc/2,10,1))
Vv <- c(rbeta(Nv/2,1,2),rbeta(Nv/2,6,2))
Opinions <- abs(outer(Vv,Cv,FUN="-"))
Opinions <- Opinions / max(Opinions)
Opinions <- 1-Opinions
loop <- TRUE
list.c <- 1:Nc
log <- NULL
while(loop){
print("candidates")
print(list.c)
votes <- t(apply(Opinions[,list.c],1,order))[,length(list.c)]
res <- tabulate(votes,length(list.c))
print("result")
print(res)
tmp <- rep(0,Nc)
tmp[list.c] <- res
log <- rbind(log, tmp)
if(max(res) > sum(res)/2){
loop <- FALSE
selected <- list.c[which(res == max(res))]
}else{
tobe.deleted <- which(res == min(res))
tobe.deleted.2 <- sample(tobe.deleted,1)
list.c <- list.c[-tobe.deleted.2]
if(length(list.c) == 1){
loop <- FALSE
selected <- list.c
}
}
}
print(selected)
matplot(log,type="l")
plot(density(Vv))
abline(v = Cv[selected],col = 2)
