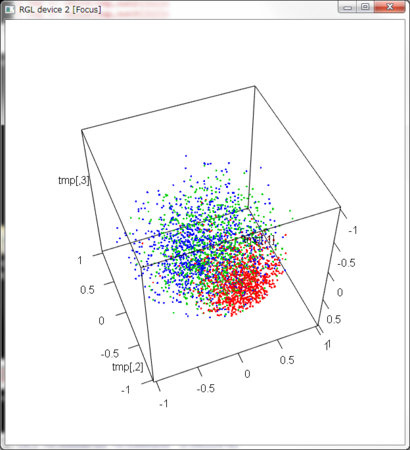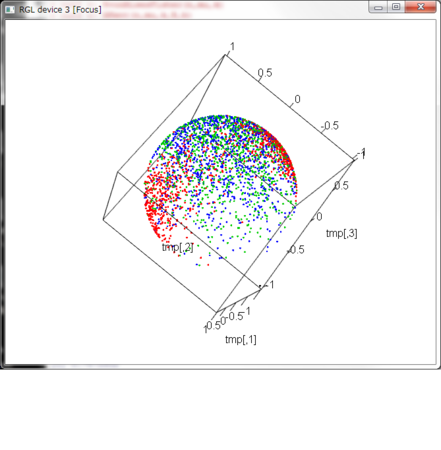
- もっとも一般化された形であるFisher-Binghamの場合は2箇所に集まる場合もある??

- 一般次元球面上の分布von Mises-Fisher分布をさらに一般化する話
- 本の中で一般化の頂点に書いてあるFisher-Bingham分布とそれより1段階簡略化してあるKent分布を取り上げる
- それぞれの分布に従う乱点発生器をcppで書いていみる
- どちらも乱点候補を作った上で、その点の生起確率に照らして確率的に採択する方法を採用する点は、vonMisesFisherのときと同じだが、今回は、最高確率点(の確率)が(僕には)わからない
- したがって、ほしい乱点の数より相当多い数の乱点を発生し、その確率に比例する値を算出し、その中での「最大値」を参照基準として採用し、それをもとに、採択してみる
- Kent分布のWiki記事はこちら
- Fisher-Bingham 分布
- この分布は
 に比例した確率
- ただし、
 は対称行列である(トレースが0であるとの制約を入れても一般性を失わないらしい…)
- Kent分布
- こちらは、Fisher-Bingham分布の確率比例成分式と同じ式で表すなら、
 の制約がきつくなっていて、
 という制限があるらしい
- この制約を別の形で書いたものがWikiの記事のそれ(だろうと思う)
- 以下のソースは、Wikiの表現に沿って書いてある
- Wikiの表現は、

- ただし、
 には制約があって、この併せて
 個のベクトルは正規直交基底をなす。また、さらに、
 であって、さらにまた、
#include <RcppArmadilloExtensions/sample.h>
using namespace Rcpp ;
List RKent(int n,NumericVector mu,double a,NumericMatrix B,NumericVector b) {
int d = mu.size();
NumericMatrix ret(n,d);
int cnt = 0;
RNGScope scope;
double vmax = 0;
for(int i=0;i<n*100;++i){
NumericVector tmp(d);
double rsq = 0;
for(int i=0;i<d;++i){
tmp[i] = ::Rf_rnorm(0,1);
rsq += tmp[i]*tmp[i];
}
rsq = sqrt(rsq);
if(rsq==0){
for(int i=0;i<d;++i){
tmp[i] = 0;
}
}else{
for(int i=0;i<d;++i){
tmp[i] /= rsq;
}
}
double tmp2 = 0;
for(int i=0;i<d;++i){
tmp2 += mu[i]*tmp[i];
}
double tmp3 = 0;
for(int j=0;j<d-1;++j){
for(int j2=0;j2<d;++j2){
tmp3 += b[j] * B(j,j2)*B(j,j2)*tmp[j2]*tmp[j2];
}
}
double tmp4 = a*tmp2+tmp3;
if(vmax < tmp4){
vmax = tmp4;
}
}
while(cnt<n){
NumericVector tmp(d);
double rsq = 0;
for(int i=0;i<d;++i){
tmp[i] = ::Rf_rnorm(0,1);
rsq += tmp[i]*tmp[i];
}
rsq = sqrt(rsq);
if(rsq==0){
for(int i=0;i<d;++i){
tmp[i] = 0;
}
}else{
for(int i=0;i<d;++i){
tmp[i] /= rsq;
}
}
double tmp2 = 0;
for(int i=0;i<d;++i){
tmp2 += mu[i]*tmp[i];
}
double tmp3 = 0;
for(int j=0;j<d-1;++j){
for(int j2=0;j2<d;++j2){
tmp3 += b[j] * B(j,j2)*B(j,j2)*tmp[j2]*tmp[j2];
}
}
double tmp4 = a*tmp2+tmp3;
NumericVector tmpr = runif(1);
if(exp(tmp4)/exp(vmax) > tmpr[0]){
for(int i=0;i<d;++i){
ret(cnt,i) = tmp[i];
}
cnt ++;
}
}
return List::create(
Named("") = ret
);
}
#include <RcppArmadilloExtensions/sample.h>
using namespace Rcpp ;
List RFisherBingham(int n,NumericVector mu,double a,NumericMatirx A) {
int d = mu.size();
NumericMatrix ret(n,d);
int cnt = 0;
RNGScope scope;
double vmax = 0;
for(int i=0;i<n*100;++i){
NumericVector tmp(d);
double rsq = 0;
for(int i=0;i<d;++i){
tmp[i] = ::Rf_rnorm(0,1);
rsq += tmp[i]*tmp[i];
}
rsq = sqrt(rsq);
if(rsq==0){
for(int i=0;i<d;++i){
tmp[i] = 0;
}
}else{
for(int i=0;i<d;++i){
tmp[i] /= rsq;
}
}
double tmp2 = 0;
for(int i=0;i<d;++i){
tmp2 += mu[i]*tmp[i];
}
double tmp3 = 0;
for(int j=0;j<d;++j){
for(int j2=0;j2<d;++j2){
tmp3 += A(j,j2)*tmp[j]*tmp[j2];
}
}
double tmp4 = a*tmp2+tmp3;
if(vmax < tmp4){
vmax = tmp4;
}
}
while(cnt<n){
NumericVector tmp(d);
double rsq = 0;
for(int i=0;i<d;++i){
tmp[i] = ::Rf_rnorm(0,1);
rsq += tmp[i]*tmp[i];
}
rsq = sqrt(rsq);
if(rsq==0){
for(int i=0;i<d;++i){
tmp[i] = 0;
}
}else{
for(int i=0;i<d;++i){
tmp[i] /= rsq;
}
}
double tmp2 = 0;
for(int i=0;i<d;++i){
tmp2 += mu[i]*tmp[i];
}
double tmp3 = 0;
for(int j=0;j<d;++j){
for(int j2=0;j2<d;++j2){
tmp3 += A(j,j2)*tmp[j]*tmp[j2];
}
}
double tmp4 = a*tmp2+tmp3;
NumericVector tmpr = runif(1);
if(exp(tmp4)/exp(vmax) > tmpr[0]){
for(int i=0;i<d;++i){
ret(cnt,i) = tmp[i];
}
cnt ++;
}
}
return List::create(
Named("") = ret
);
}
library(rgl)
library(GPArotation)
d <-3
mu <- c(1,rep(0,d-1))
k <- 10
n <- 1000
A <- matrix(rnorm((d-1)^2),d-1,d-1)
A <- A + t(A)
colsumA <- apply(A,2,sum)
A <- rbind(A,colsumA)
A <- cbind(A,c(colsumA,0))
A[d,d] <- -sum(diag(A))

Rot <- Random.Start(d)
mu <- Rot[1,]
B <- Rot[-1,]

b <- runif(d-1)*k/2
b <- b *sample(c(-1,1),d-1,replace=TRUE)
b[1] <- -sum(b[-1])
out <- RFisherBingham(n,mu,k,A)
out2 <- RvonMisesFisher(n,mu,k)
out3 <- RKent(n,mu,k,B,b)
tmp <- out[[1]]
tmp <- rbind(tmp,out2[[1]])
tmp <- rbind(tmp,out3[[1]])
tmp <- rbind(tmp,rep(1,d))
tmp <- rbind(tmp,rep(-1,d))
col <- c(rep(2,n),rep(3,n),rep(4,n),rep(1,2))
plot3d(tmp,col=col)

varianceMatrix(out[[1]])
varianceMatrix(out2[[1]])
varianceMatrix(out3[[1]])
> varianceMatrix(out[[1]])
$mean.vector
[1]  0.02608433 -0.21177823 -0.91789828

$mean.resultant.length
[1] 0.9423734

$`R-squared`
[1] 0.8880677

$traceS
[1] 0.1119323

$variance.matrix
             [,1]         [,2]         [,3]
[1,]  0.048742494  0.008049186 -0.001930237
[2,]  0.008049186  0.055520945 -0.014063977
[3,] -0.001930237 -0.014063977  0.007668896

> varianceMatrix(out2[[1]])
$mean.vector
[1] -0.1881736 -0.5356760 -0.7013350

$mean.resultant.length
[1] 0.9023463

$`R-squared`
[1] 0.8142289

$traceS
[1] 0.1857711

$variance.matrix
             [,1]        [,2]         [,3]
[1,]  0.082500056 -0.01095979 -0.008590725
[2,] -0.010959792  0.06215634 -0.038852547
[3,] -0.008590725 -0.03885255  0.041114741

> varianceMatrix(out3[[1]])
$mean.vector
[1] -0.2686173 -0.5385084 -0.6501932

$mean.resultant.length
[1] 0.8859446

$`R-squared`
[1] 0.7848977

$traceS
[1] 0.2151023

$variance.matrix
            [,1]        [,2]        [,3]
[1,]  0.10149980 -0.01644634 -0.02063905
[2,] -0.01644634  0.06314805 -0.03382721
[3,] -0.02063905 -0.03382721  0.05045440
に比例した確率
は対称行列である(トレースが0であるとの制約を入れても一般性を失わないらしい…)

