- 前の記事で自由度のこととか出てきた。複雑なモデルにしてフィッティングをよくするか、単純なモデルでフィッティングを犠牲にするかはいつも問題になる。問題になるということは、基準がある。検定もできる
- 1次元データでやってみる

n <- 1000
t <- seq(from=-4,to=4,length=n)
y1 <- (1-t^2)*exp(-t^2/2)
plot(t,y1)
y2 <- abs((t-2)/3)
y3 <- 5/(t+5)
y4 <- y1-2*y2+y3
plot(t,y4,type="l")
x <- t+rnorm(length(t),0,0.5)
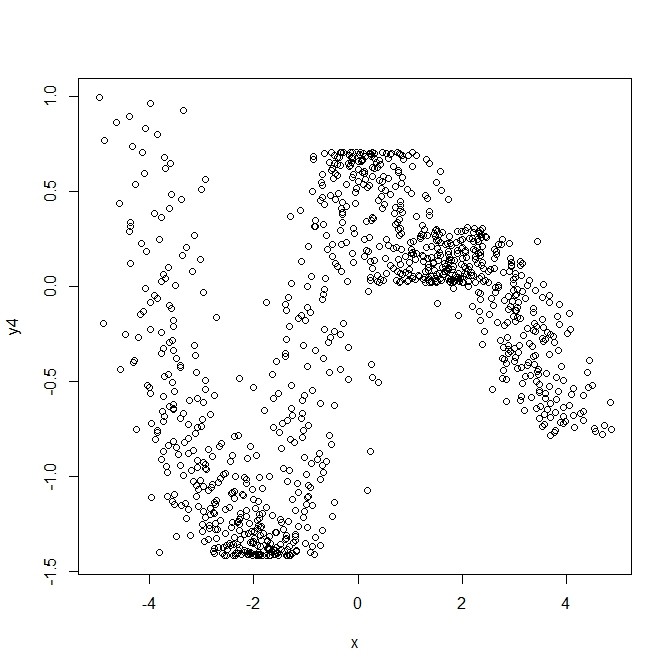
plot(x,y4)
lm.out <- lm(y4~x)
lm.out.null <- lm(y4~1)
anova(lm.out.null,lm.out)
> anova(lm.out.null,lm.out)
Analysis of Variance Table

Model 1: y4 ~ 1
Model 2: y4 ~ x
  Res.Df    RSS Df Sum of Sq      F    Pr(>F)
1    999 432.17
2    998 372.02  1    60.148 161.36 < 2.2e-16 ***
---
Signif. codes:  0 ‘***’ 0.001 ‘**’ 0.01 ‘*’ 0.05 ‘.’ 0.1 ‘ ’ 1
-
- gam()では、帰無仮説(xを加味しない)も、線形回帰も、Local回帰もできるのでそれぞれやる
- 帰無対線形回帰、線形回帰対Local回帰をやってみる。テストはFテストとChisqテストがある。Fでいいと思うが…
- 帰無対線形回帰は、lm()を使った場合ともちろん同じ
gam.out.null <- gam(y4~1)
gam.out.lin <- gam(y4~x)
gam.out <- gam(y4~s(x))

anova(gam.out.null,gam.out.lin,test="F")
anova(gam.out.null,gam.out.lin,test="Chisq")
anova(gam.out.lin,gam.out,test="F")
anova(gam.out.lin,gam.out,test="Chisq")
> anova(gam.out.null,gam.out.lin,test="F")
Analysis of Deviance Table

Model 1: y4 ~ 1
Model 2: y4 ~ x
  Resid. Df Resid. Dev Df Deviance      F    Pr(>F)
1       999     432.17
2       998     372.02  1   60.148 161.36 < 2.2e-16 ***
---
Signif. codes:  0 ‘***’ 0.001 ‘**’ 0.01 ‘*’ 0.05 ‘.’ 0.1 ‘ ’ 1
> anova(gam.out.null,gam.out.lin,test="Chisq")
Analysis of Deviance Table

Model 1: y4 ~ 1
Model 2: y4 ~ x
  Resid. Df Resid. Dev Df Deviance  Pr(>Chi)
1       999     432.17
2       998     372.02  1   60.148 < 2.2e-16 ***
---
Signif. codes:  0 ‘***’ 0.001 ‘**’ 0.01 ‘*’ 0.05 ‘.’ 0.1 ‘ ’ 1
> anova(gam.out.lin,gam.out,test="F")
Analysis of Deviance Table

Model 1: y4 ~ x
Model 2: y4 ~ s(x)
  Resid. Df Resid. Dev     Df Deviance     F    Pr(>F)
1    998.00     372.02
2    990.51     134.22 7.4933    237.8 234.2 < 2.2e-16 ***
---
Signif. codes:  0 ‘***’ 0.001 ‘**’ 0.01 ‘*’ 0.05 ‘.’ 0.1 ‘ ’ 1
> anova(gam.out.lin,gam.out,test="Chisq")
Analysis of Deviance Table

Model 1: y4 ~ x
Model 2: y4 ~ s(x)
  Resid. Df Resid. Dev     Df Deviance  Pr(>Chi)
1    998.00     372.02
2    990.51     134.22 7.4933    237.8 < 2.2e-16 ***
---
Signif. codes:  0 ‘***’ 0.001 ‘**’ 0.01 ‘*’ 0.05 ‘.’ 0.1 ‘ ’ 1
-
- loess()だとどうなるか…。loess()は帰無仮説の回帰式を受け付けないが、普通の線形回帰は、すべてのレコードをいつも考慮するというようにすれば、曲りなりに、線形回帰に近くできそうだ。ただし、重みづけ関数があるので、完全に線形には持ちこめなさそう。loess()でのモデルの比較は、どれくらい細かくするのがよいかのspanパラメタの調整のために役に立つ、というような意味合いのような感じに見える。ただし、gam()の出力と比較して、Chisq値、自由度などを取り回せば、線形モデル、帰無モデルとの検定もやれなくはないだろう
loess.out.pseudolin <- loess(y4~x,span=1,degree=2)
loess.out <- loess(y4~x,span=0.5,degree=2)
anova(loess.out.pseudolin,loess.out)
> anova(loess.out.pseudolin,loess.out)
Model 1: loess(formula = y4 ~ x, span = 1, degree = 2)
Model 2: loess(formula = y4 ~ x, span = 0.5, degree = 2)

Analysis of Variance:   denominator df 992.57

      ENP    RSS F-value    Pr(>F)
[1,] 3.34 242.18
[2,] 6.54 139.09  179.43 < 2.2e-16 ***
---
Signif. codes:  0 ‘***’ 0.001 ‘**’ 0.01 ‘*’ 0.05 ‘.’ 0.1 ‘ ’ 1
-
- anova.loess()に関する説明ページ(こちら)
