library(kernlab)
alpha <- 0.7
rbfk <- rbfdot(alpha)
x <- rnorm(3)
y <- rnorm(3)
rbfk(x,y)
exp(-alpha*sum((x-y)^2))
The Gaussian RBF kernel k(x,x') = \exp(-σ \|x - x'\|^2)
The Polynomial kernel k(x,x') = (scale <x, x'> + offset)^{degree}
The Linear kernel k(x,x') = <x, x'>
The Hyperbolic tangent kernel k(x, x') = \tanh(scale <x, x'> + offset)
The Laplacian kernel k(x,x') = \exp(-σ \|x - x'\|)
The Bessel kernel k(x,x') = (- Bessel_{(ν+1)}^n σ \|x - x'\|^2)
The ANOVA RBF kernel k(x,x') = ��_{1≤q i_1 … < i_D ≤q N} ∏_{d=1}^D k(x_{id}, {x'}_{id}) where k(x,x) is a Gaussian RBF kernel.
The Spline kernel ∏_{d=1}^D 1 + x_i x_j + x_i x_j min(x_i, x_j) - \frac{x_i + x_j}{2} min(x_i,x_j)^2 + \frac{min(x_i,x_j)^3}{3} \ The String kernels
-
- カーネル関数を追加したいときには、rbfカーネルの作り(以下にコードを表示)に倣って作れば良いはず
> rbfdot
function (sigma = 1)
{
    rval <- function(x, y = NULL) {
        if (!is(x, "vector"))
            stop("x must be a vector")
        if (!is(y, "vector") && !is.null(y))
            stop("y must a vector")
        if (is(x, "vector") && is.null(y)) {
            return(1)
        }
        if (is(x, "vector") && is(y, "vector")) {
            if (!length(x) == length(y))
                stop("number of dimension must be the same on both data points")
            return(exp(sigma * (2 * crossprod(x, y) - crossprod(x) -
                crossprod(y))))
        }
    }
    return(new("rbfkernel", .Data = rval, kpar = list(sigma = sigma)))
}
<bytecode: 0x0000000033f4bc90>
<environment: namespace:kernlab>
-
- 次のように作ってみる。できるカーネル関数オブジェクトの「名前」が"rbfkernel"のままにしているところは、ちょっと不安…。ただしこの名前には使ってよいものが定まっている模様なので勝手な名前はつけられないようだ
mydot <- function (sigma = 1)
{
rval <- function(x, y = NULL) {
if (!is(x, "vector"))
stop("x must be a vector")
if (!is(y, "vector") && !is.null(y))
stop("y must a vector")
if (is(x, "vector") && is.null(y)) {
return(1)
}
if (is(x, "vector") && is(y, "vector")) {
if (!length(x) == length(y))
stop("number of dimension must be the same on both data points")
return(exp(sigma^2 * (2 * crossprod(x, y) - crossprod(x) -
crossprod(y))))
}
}
return(new("rbfkernel", .Data = rval, kpar = list(sigma = sigma)))
}
myk <- mydot(alpha)
myk(x,y)
kernelMatrix(myk,matrix(rnorm(3*5),ncol=3))
- グラム行列(観測標本のペアワイズなカーネル関数値が作る行列(参考)を返すようなユーティリティ関数もある。下記のグラム行列計算以外に、グラム行列に関連するいくつかの関数がある。
> kernelMatrix(rbfk,matrix(rnorm(3*5),ncol=3))
An object of class "kernelMatrix"
            [,1]         [,2]        [,3]        [,4]         [,5]
[1,] 1.000000000 0.3713819754 0.144911259 0.123303611 0.0002786590
[2,] 0.371381975 1.0000000000 0.543098668 0.319933983 0.0003908834
[3,] 0.144911259 0.5430986680 1.000000000 0.187320931 0.0056001489
[4,] 0.123303611 0.3199339829 0.187320931 1.000000000 0.0058092391
[5,] 0.000278659 0.0003908834 0.005600149 0.005809239 1.0000000000
- カーネル法
- Vignettesで取り上げているカーネル法をまず挙げる
- サポートベクターマシン
- Relevance vector machine
- Gaussian Processes
- Ranking
- Online learning with kernels
- Spectral clustering
- Kernel PCA
- Kernel feature analysis
- Kernel canonical correlation analysis
- いわゆるカーネルを使った解析手法、というより、カーネルを使った応用道具としては以下のようなものが取り上げられている
- Interior point code quadratic optimizer
- Incomplete cholesky decomposition
- SVM
- ksvm()関数
- トレーニングデータセットのヒルベルトスペース上の関数の線形関数の最適なものを探索する
- 最適条件としては、与えた制約の下での、何かしらの関数の最適探索となる
- ヒルベルトスペースを決めるのはカーネル関数なので、それに依存した答えが返る
- "ksvm can be used for classification , for regression, or for novelty detection"とあるように、どのような課題かをtype引数が決める
- default は分類なら C-svc、回帰なら、eps-svr
- kernel 引数でカーネル関数を決め、kpar引数でkernel関数の引数を与える
- cross 引数はクロスバリデーションの回数
- C 引数はマージンの厳しさ(C パラメタと計算時間についてはこちら)
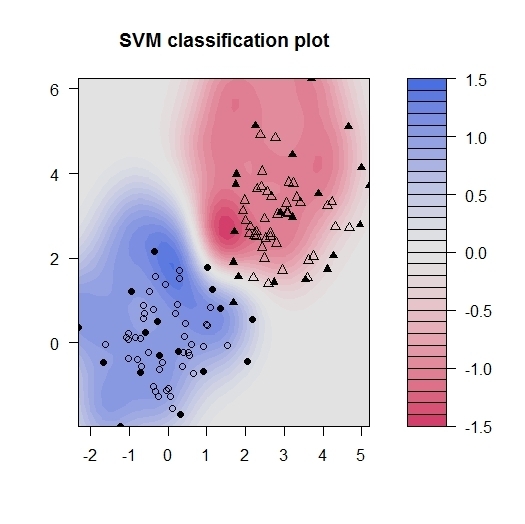
- 以下の例は、多数のカテゴリカル説明変数で+/-のクラスを弁別する課題。マージンを取って弁別したい例。サンプルの多数をトレーニングとして弁別器を作り、5つをテストセットとして性能を見ている
data(promotergene)
tindex <- sample(1:dim(promotergene)[1],5)
genetrain <- promotergene[-tindex, ]
genetest <- promotergene[tindex,]
gene <- ksvm(Class~.,data=genetrain,kernel="rbfdot",kpar="automatic",C=60,cross=3,prob.model=TRUE)
gene
set.seed(123)
x <- rbind(matrix(rnorm(120),,2),matrix(rnorm(120,mean=3),,2))
y <- matrix(c(rep(1,60),rep(-1,60)))
svp <- ksvm(x,y)
plot(svp,data=x)

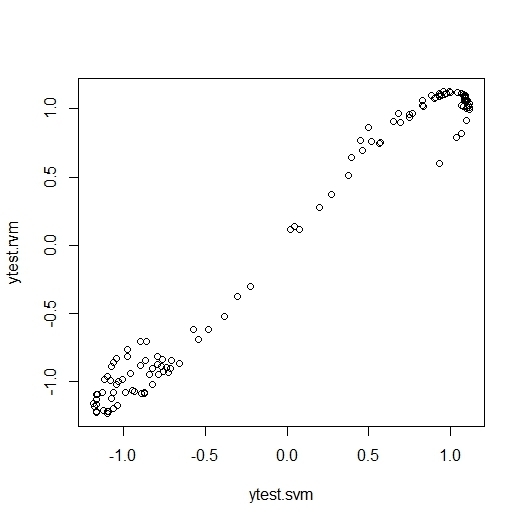
- Relevance Vector Machine はSVMのベイズ版
- Regressionだけが実装されている。同様式実装なので結果比較は簡単
- ベイズなので事前予測値 alpha を指定できる
x <- rbind(matrix(rnorm(120),,2),matrix(rnorm(120,mean=3),,2))
y <- matrix(c(rep(1,60),rep(-1,60)))

rvmm <- rvm(x, y,kernel="rbfdot",kpar=list(sigma=0.1))
rvmm
ytest.rvm <- predict(rvmm, x)

svmm <- ksvm(x,y,kernel="rbfdot",kpar=list(sigma=0.1))
svmm
ytest.svm <- predict(svmm,x)

plot(ytest.svm,ytest.rvm)
> rvmm
Relevance Vector Machine object of class "rvm"
Problem type: regression

Gaussian Radial Basis kernel function.
 Hyperparameter : sigma =  0.1

Number of Relevance Vectors : 13
Variance :  0.0652819
Training error : 0.062691195

> svmm
Support Vector Machine object of class "ksvm"

SV type: eps-svr  (regression)
 parameter : epsilon = 0.1  cost C = 1

Gaussian Radial Basis kernel function.
 Hyperparameter : sigma =  0.1

Number of Support Vectors : 73

Objective Function Value : -18.2939
Training error : 0.088148

- Gaussian processes
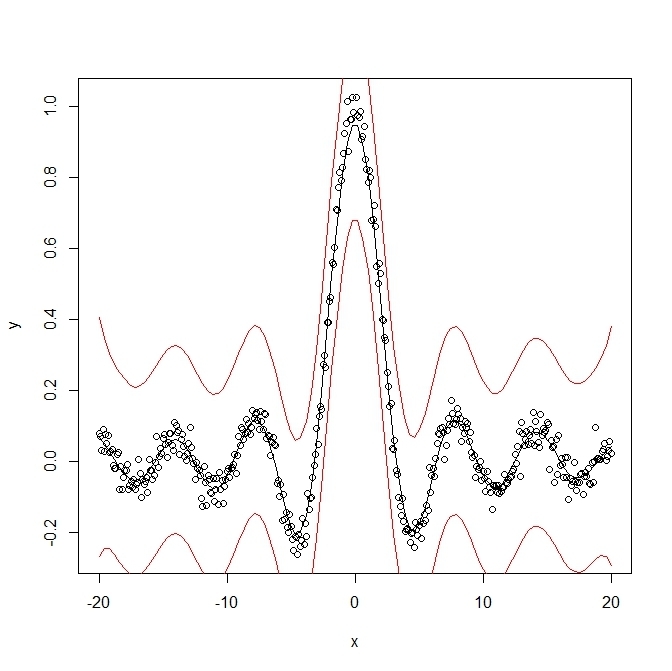
- 近いものの「値」は似ていて、遠いものの「値」は似ていないとする。その似ている程度を観測点間行列で表す。また、観測には、乱雑項が入っているものとして推定する
x <- seq(-20,20,0.1)
y <- sin(x)/x + rnorm(401,sd=0.03)
plot(x,y)
foo2 <- gausspr(x, y, variance.model = TRUE)
xtest <- seq(min(x),max(x),length=100)
lines(xtest, predict(foo2, xtest))
lines(xtest,
predict(foo2, xtest)+2*predict(foo2,xtest, type="sdeviation"),
col="red")
lines(xtest,
predict(foo2, xtest)-2*predict(foo2,xtest, type="sdeviation"),
col="red")

- Ranking
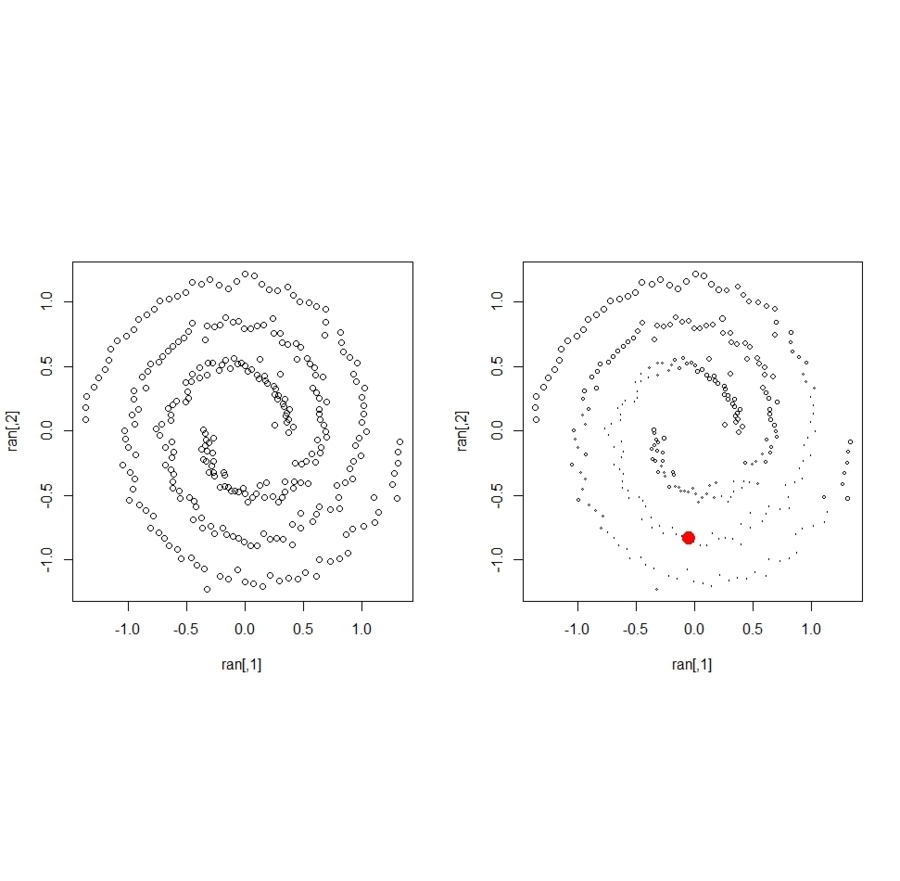
- 点間の遠近を定め、それに応じて、Connected graphを作る。各点に値を与え、その値をグラフ上で移動させる。値は、移動する分と与える値をそのまま引き継ぐ分とに一定の割合で分ける。繰り返し処理で平衡に達せしめる
ran <- spirals
n <- length(ran[,1])
N <- sample(1:n,1)
ranked <- ranking(ran, N, kernel = "rbfdot",
kpar = list(sigma = 100), edgegraph = TRUE)
ranked[N, 2] <- max(ranked[-N, 2])
c<-1:n
op <- par(mfrow = c(1, 2),pty="s")
plot(ran)
plot(ran, cex=c[ranked[,3]]/n)
points(ran[N,1],ran[N,2],cex = 3, col=2,pch=20)

- Online learning
- おそらく、だが、サンプルが逐次入力されるような場合に、推定モデルを逐次更新しつつ、最終結果が、「サンプルを一括して受け取ったときと同じになる」ようなアルゴリズム。。。
- 基本的には、モデルをサンプルに合わせて作りつつ、それがもたらすオーバーフィッティングを正則化項で修正する。その正則化項が、ヒルベルト空間の内積になっている。逐次更新にあたっては、「その時点までのモデルから、新規標本が与えるずれに合わせて変化させる分について、ブレーキをかけつつ、新モデルにシフトする」と言ったアルゴリズム:stochastic gradient descent
on <- inlearn(2,kernel="rbfdot",kpar=list(sigma=0.2),
type="classification")
on2 <- on
ind <- sample(1:n,n)
for(i in ind)
on <- onlearn(on,x[i,],y[i],nu=0.03,lambda=0.1)
on2 <- onlearn(on2,x[ind,],y[ind],nu=0.03,lambda=0.1)
sign(predict(on,x))
sign(predict(on2,x))
range(predict(on2,x)-predict(on,x))
- Spectral clustering
- Rankingと同様な方法でローカルな遠近を利用する。その上で、ガウス行列を固有値分解し、主要成分のみで座標化しkmeansクラスタリングする
- Kernel PCA
- Kernel feature analysis
- Kernel PCAはそれなりに重い。そこを改善し、説明次元が下がるようにしてある
- Kernel canonical correlation analysis
- 正準相関分析の説明変数をヒルベルト空間の点(関数)に置き換えて尾kなう
- Interior point code quadratic optimizer
- カーネル法は、ヒルベルト空間での最小化問題。以下のような問題に帰着できることが多く、逆に言えば、以下のような問題の答えを返すようなoptimizerが欲しい
 を最小化する
- ただし
 で、
で、 なる制約の元で
- Incomplete cholesky decomposition
- カーネル行列は正定値。正定値行列はコレスキー分解して三角行列にできるが、そもそもカーネル行列のランクは高くないことが普通なので、大きいまま計算しなくてもよいことになる。そんな工夫もする
- 関数名はinc.chol()


