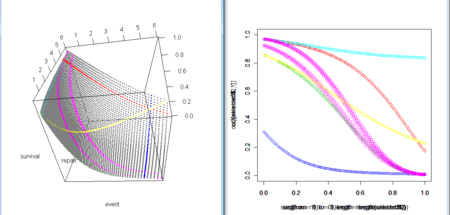
- イベントと修理が確率的に起きているとき、累積してフェノタイプに影響を与える確率が3次元空間中の曲面で表された
- ここで、イベント生起確率・修理確率に濃度依存的に影響を与える物質があり、その濃度-サバイバル関係を調べるということは、その物質が濃度別に、この曲面のどこにあたるかをとり、その軌跡を取り出すことになる

matrixA<-function(p,q,n,open=FALSE){
k<-p
h<-q
N<-n
M<-matrix(0,N,N)
M[1,1]<--k
M[1,2]<-h
M[2,1]<-k
M[2,2]<--(k+h)
M[2,3]<-h
for(i in 2:(N-1)){
M[i,i-1]<-k
M[i,i]<--(k+h)
M[i,i+1]<-h
}
M[N,N-1]<-k
if(open){
M[N,N]<--(k+h)
}else{
M[N,N]<--h
}
M
}
my.ShokiChi<-function(A,v0,t){
n<-length(v0)
eigen.out<-eigen(A)
V<-eigen.out[[2]]
U<-solve(V)
B<-diag(eigen.out[[1]])
x<-t
Ys<-matrix(0,length(x),n)
Ys0<-v0
for(i in 1:(length(x))){
Bex<-diag(exp(eigen.out[[1]]*x[i]))
Ys[i,]<-V%*%(Bex%*%(U%*%Ys0))
}
ReYs<-Re(Ys)
ReYs[which(ReYs<0)]<-0
ReYs
}
Syufuku.Poisson<-function(p,q,n,maxk=NULL,t=1,open=FALSE){
k<-0:n
if(!is.null(maxk)){
k<-0:maxk
}
ret<-rep(0,length(k))
if(p==0){
if(q==0){
ret<-rep(-1,length(k))
}else{
ret[which(k>=0)]<-1
}
}else{
if(q==0){
ret<-ppois(k,p*t)
}else{
A<-matrixA(p=p,q=q,n=n,open=open)
v0<-c(1,rep(0,n-1))
my.out<-my.ShokiChi(A,v0,t)
ret<-cumsum(my.out)
}
}
ret
}
t<-1
maxPQ<-6
kq<-exp(seq(from=-log(maxPQ),to=log(maxPQ),length=100))
kp<-kq
q<-kq
p<-kp
n<-20
maxk<-10
pqt<-expand.grid(p,q,t)
out<-matrix(0,length(pqt[,1]),maxk)
for(i in 1:length(pqt[,1])){
out[i,]<-Syufuku.Poisson(p=pqt[i,1],q=pqt[i,2],t=pqt[i,3],n=n)[1:maxk]
}
library(rgl)
plot3d(log(pqt[,1]),log(pqt[,2]),out[,1],zlim=c(0,1))
plot3d(pqt[,1],pqt[,2],out[,1],zlim=c(0,1))
points3d(pqt[,1],pqt[,2],out[,2],col=2)
plot3d(log(pqt[,1]),log(pqt[,2]),out[,1],type="l",zlim=c(0,1))
plot3d(pqt[,1],pqt[,2],out[,1],zlim=c(0,1))
for(i in 2:maxk){
points3d(pqt[,1],pqt[,2],out[,i],col=i)
}
col<-rep(gray(0.5),length(pqt[,1]))
selected1 <- which(pqt[,2]==q[length(q)-5])
selected2 <- which(pqt[,2]==q[5])
selected3 <- which(pqt[,1]==p[length(p)-5])
selected4 <- which(pqt[,1]==p[5])
selected5 <- which(abs(log(pqt[,1])+log(pqt[,2])-1)<0.05)
selected5.2 <- which(abs(log(pqt[,1])+log(pqt[,2]))<0.05)
selected6 <- which(pqt[,1]==pqt[,2])
col[selected1]<-2
col[selected2]<-3
col[selected3]<-4
col[selected4]<-5
col[selected5]<-6
col[selected5.2]<-6
col[selected6]<-7
plot3d(pqt[,1],pqt[,2],out[,1],zlim=c(0,1),col=col,cex=0.01,xlab="event",ylab="repair",zlab="survival")
plot(seq(from=0,to=1,length=length(selected1)),out[selected1,1],col=2,xlim=c(0,1),ylim=c(0,1))
par(new=TRUE)
plot(seq(from=0,to=1,length=length(selected2)),out[selected2,1],col=3,xlim=c(0,1),ylim=c(0,1))
par(new=TRUE)
plot(seq(from=1,to=0,length=length(selected3)),out[selected3,1],col=4,xlim=c(0,1),ylim=c(0,1))
par(new=TRUE)
plot(seq(from=1,to=0,length=length(selected4)),out[selected4,1],col=5,xlim=c(0,1),ylim=c(0,1))
par(new=TRUE)
plot(seq(from=1,to=0,length=length(selected5)),out[selected5,1],col=6,xlim=c(0,1),ylim=c(0,1))
par(new=TRUE)
plot(seq(from=1,to=0,length=length(selected5.2)),out[selected5.2,1],col=6,xlim=c(0,1),ylim=c(0,1))
par(new=TRUE)
plot(seq(from=0,to=1,length=length(selected6)),out[selected6,1],col=7,xlim=c(0,1),ylim=c(0,1))
- 上のソースは濃度を指数関数的に変化させたもの
- 下のソースは濃度を等間隔で変化させたもの
matrixA<-function(p,q,n,open=FALSE){
k<-p
h<-q
N<-n
M<-matrix(0,N,N)
M[1,1]<--k
M[1,2]<-h
M[2,1]<-k
M[2,2]<--(k+h)
M[2,3]<-h
for(i in 2:(N-1)){
M[i,i-1]<-k
M[i,i]<--(k+h)
M[i,i+1]<-h
}
M[N,N-1]<-k
if(open){
M[N,N]<--(k+h)
}else{
M[N,N]<--h
}
M
}
my.ShokiChi<-function(A,v0,t){
n<-length(v0)
eigen.out<-eigen(A)
V<-eigen.out[[2]]
U<-solve(V)
B<-diag(eigen.out[[1]])
x<-t
Ys<-matrix(0,length(x),n)
Ys0<-v0
for(i in 1:(length(x))){
Bex<-diag(exp(eigen.out[[1]]*x[i]))
Ys[i,]<-V%*%(Bex%*%(U%*%Ys0))
}
ReYs<-Re(Ys)
ReYs[which(ReYs<0)]<-0
ReYs
}
Syufuku.Poisson<-function(p,q,n,maxk=NULL,t=1,open=FALSE){
k<-0:n
if(!is.null(maxk)){
k<-0:maxk
}
ret<-rep(0,length(k))
if(p==0){
if(q==0){
ret<-rep(-1,length(k))
}else{
ret[which(k>=0)]<-1
}
}else{
if(q==0){
ret<-ppois(k,p*t)
}else{
A<-matrixA(p=p,q=q,n=n,open=open)
v0<-c(1,rep(0,n-1))
my.out<-my.ShokiChi(A,v0,t)
ret<-cumsum(my.out)
}
}
ret
}
t<-1
maxPQ<-40
kq<-seq(from=1,to=maxPQ,by=0.1)
kp<-kq
q<-kq
p<-kp
n<-20
maxk<-10
pqt<-expand.grid(p,q,t)
out<-matrix(0,length(pqt[,1]),maxk)
for(i in 1:length(pqt[,1])){
out[i,]<-Syufuku.Poisson(p=pqt[i,1],q=pqt[i,2],t=pqt[i,3],n=n)[1:maxk]
}
library(rgl)
plot3d(log(pqt[,1]),log(pqt[,2]),out[,1],zlim=c(0,1))
plot3d(pqt[,1],pqt[,2],out[,1],zlim=c(0,1))
points3d(pqt[,1],pqt[,2],out[,2],col=2)
plot3d(log(pqt[,1]),log(pqt[,2]),out[,1],type="l",zlim=c(0,1))
plot3d(pqt[,1],pqt[,2],out[,1],zlim=c(0,1))
for(i in 2:maxk){
points3d(pqt[,1],pqt[,2],out[,i],col=i)
}
col<-rep(gray(0.5),length(pqt[,1]))
selected1 <- which(pqt[,2]==q[length(q)-5])
selected2 <- which(pqt[,2]==q[5])
selected3 <- which(pqt[,1]==p[length(p)-5])
selected4 <- which(pqt[,1]==p[5])
selected5 <- which(pqt[,1]+pqt[,2]==maxPQ/2)
selected6 <- which(pqt[,1]==pqt[,2])
col[selected1]<-2
col[selected2]<-3
col[selected3]<-4
col[selected4]<-5
col[selected5]<-6
col[selected6]<-7
plot3d(pqt[,1],pqt[,2],out[,1],zlim=c(0,1),col=col,cex=0.01,xlab="event",ylab="repair",zlab="survival")
plot(pqt[selected1,1],out[selected1,1],col=2,xlim=range(pqt[,1]),ylim=c(0,1))
par(new=TRUE)
plot(pqt[selected2,1],out[selected2,1],col=3,xlim=range(pqt[,1]),ylim=c(0,1))
par(new=TRUE)
plot(pqt[selected3[length(selected3):1],2],out[selected3,1],col=4,xlim=range(pqt[,1]),ylim=c(0,1))
par(new=TRUE)
plot(pqt[selected4[length(selected4):1],2],out[selected4,1],col=5,xlim=range(pqt[,1]),ylim=c(0,1))
par(new=TRUE)
plot(pqt[selected5,1],out[selected5,1],col=6,xlim=range(pqt[,1]),ylim=c(0,1))
par(new=TRUE)
plot(pqt[selected6,1],out[selected6,1],col=7,xlim=range(pqt[,1]),ylim=c(0,1))
