- 受精卵から卵割を繰り返してできる2分岐木を四分円域内に描くとしよう
- 四分扇の片方の露出半径は生殖細胞系列群で、次世代につながっていく

k <- 11
v.list <- list()
v.list[[1]] <- c(1)
e.list <- NULL
theta.list <- list()
theta.list[[1]] <- c(0)
rs <- (1:k)-1
xy <- matrix(c(0,0),ncol=2)
col.prebirth <- 2
col.postbirth <- 3
cols <- c(col.prebirth)
birth <- 6
for(i in 2:k){
tmp <- max(v.list[[i-1]])
v.list[[i]] <- (tmp+1):(tmp+2^(i-1))
theta.list[[i]] <- seq(from = 0, to = pi/2,length=2^(i-1))
e.list <- rbind(e.list,matrix(c(v.list[[i]],(v.list[[i]])%/%2),ncol=2))
xy <- rbind(xy,matrix(c(rs[i]*cos(theta.list[[i]]),rs[i]*sin(theta.list[[i]])),ncol=2))
if(i < birth){
cols <- c(cols,rep(col.prebirth,2^(i-1)))
}else{
cols <- c(cols,rep(col.postbirth,2^(i-1)))
}
}
library(igraph)
g <- graph.edgelist(e.list,directed = FALSE)
plot(xy,col=cols,pch=20)
segments(xy[e.list[,1],1],xy[e.list[,1],2],xy[e.list[,2],1],xy[e.list[,2],2],col="gray")
- 生殖細胞系列への運命が決まったところから色を変えてみる
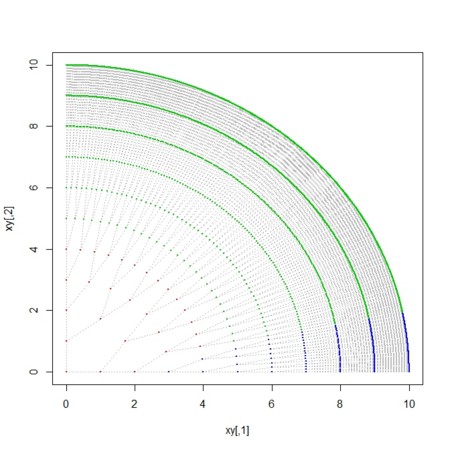
gamate <- 4
s <- 2^(gamate-1)
reach <- shortest.paths(g,s,mode="out")
col.gamate <- 4
col.gm <- cols
col.gm[which(reach!=Inf)] <- col.gamate
plot(xy,col=col.gm,pch=20,cex=0.1)
segments(xy[e.list[,1],1],xy[e.list[,1],2],xy[e.list[,2],1],xy[e.list[,2],2],col="gray",lty=3)
points(xy,col=col.gm,cex=0.3,pch=20)
- 体細胞モザイクでは、発生途中のあるところから以下が亜群を形成する
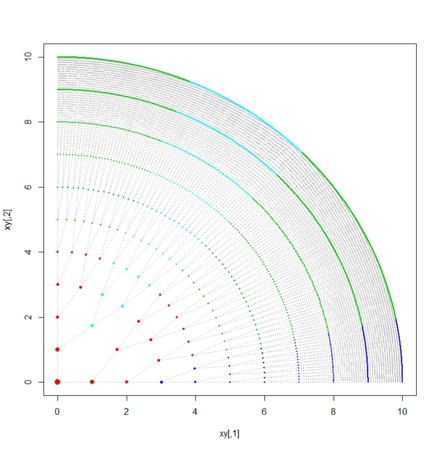
mosaic <- 3
ms <- sample(v.list[[mosaic]],1)
reach.m <- shortest.paths(g,ms,mode="out")
col.mosaic <- 5
col.ms <- col.gm
col.ms[which(reach.m!=Inf)] <- col.mosaic
plot(xy,col=col.ms,pch=20,cex=0.1)
segments(xy[e.list[,1],1],xy[e.list[,1],2],xy[e.list[,2],1],xy[e.list[,2],2],col="gray",lty=3)
points(xy,col=col.ms,cex=cexx*2,pch=20)
- 癌は(生後、基本的には増殖が激しくなくなった段階で)制御できない細胞増殖がおきていることを指す
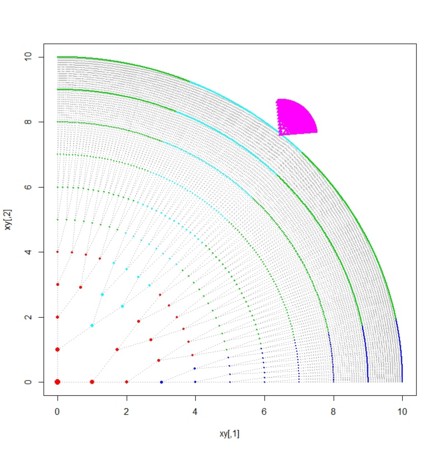
plot(xy,col=col.ms,pch=20,cex=0.1)
segments(xy[e.list[,1],1],xy[e.list[,1],2],xy[e.list[,2],1],xy[e.list[,2],2],col="gray",lty=3)
points(xy,col=col.ms,cex=cexx*2,pch=20)
cancer <- sample(v.list[[k]],1)
k.cancer <- k
cancer.xy <- xy[cancer,]
cancer.theta <- unlist(theta.list)[cancer]-pi/4
M.cancer <- matrix(c(cos(cancer.theta),-sin(cancer.theta),sin(cancer.theta),cos(cancer.theta)),byrow=TRUE,2,2)
cancer.x <- 0.1
cancers <- xy[1:sum(2^(0:(k.cancer-1))),]
cancers <- M.cancer %*% t(cancers)
cancers <- cancers*cancer.x
cancers <- t((cancers) + cancer.xy)
col.cancer <- 6
points(cancers,pch=17,cex=1,col=col.cancer)
- 癌のように増殖はしないが、成人細胞が特殊な機能を獲得したとしてそれを目立たせるには
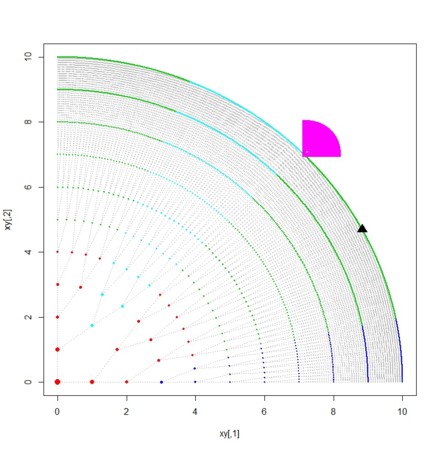
plot(xy,col=col.ms,pch=20,cex=0.1)
segments(xy[e.list[,1],1],xy[e.list[,1],2],xy[e.list[,2],1],xy[e.list[,2],2],col="gray",lty=3)
points(xy,col=col.ms,cex=cexx*2,pch=20)
cancer.fx <- sample(v.list[[k]],2)
cancer <- cancer.fx[1]
k.cancer <- k
cancer.xy <- xy[cancer,]
cancer.theta <- unlist(theta.list)[cancer]-pi/4
M.cancer <- matrix(c(cos(cancer.theta),-sin(cancer.theta),sin(cancer.theta),cos(cancer.theta)),byrow=TRUE,2,2)
cancer.x <- 0.1
cancers <- xy[1:sum(2^(0:(k.cancer-1))),]
cancers <- M.cancer %*% t(cancers)
cancers <- cancers*cancer.x
cancers <- t((cancers) + cancer.xy)
col.cancer <- 6
points(cancers,pch=15,cex=1,col=col.cancer)
fx <- cancer.fx[2]
fx.xy <- xy[fx,]
col.fx <- 9
points(fx.xy[1],fx.xy[2],pch=17,cex=2,col=col.fx)
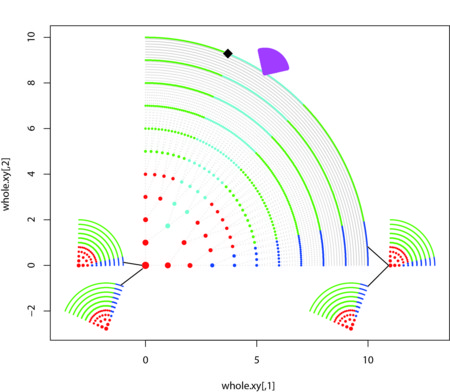
ind.1 <- rbind(xy,cancers,fx.xy)
col.1 <- c(col.ms,rep(col.cancer,length(cancers[,1])),col.fx)
cex.1 <- c(cexx*2,rep(1,length(cancers[,1])),2)
pchs.1 <- c(rep(20,length(xy[,1])),rep(16,length(cancers[,1])),18)
plot(ind.1,col=col.1,cex=cex.1,pch=pchs.1)
segments(xy[e.list[,1],1],xy[e.list[,1],2],xy[e.list[,2],1],xy[e.list[,2],2],col="gray",lty=3)
points(ind.1,col=col.1,cex=cex.1,pch=pchs.1)
ind.0 <- xy
col.0 <- col.gm
cex.0 <- cexx*2
pch.0 <- 20
father <- xy
father <- father * 0.2
a <- 0.5
father[,1] <- father[,1]-max(father[,1])+(min(father[,1])-max(father[,1]))*a
rot.t <- pi/2-pi/8
rot <- matrix(c(cos(rot.t),-sin(rot.t),sin(rot.t),cos(rot.t)),byrow=TRUE,2,2)
mother <- t(rot %*% t(father))
mother[,1] <- mother[,1]-(max(mother[,1])-max(father[,1]))
parents <- rbind(father,mother)
plot(parents,col=rep(col.0,2),cex=rep(cex.0,2),pch=pch.0)
haiguusya <- mother
haiguusya[,1] <- haiguusya[,1] -(max(haiguusya[,1])-max(ind.1[,1]))
grandchild <- father
grandchild[,1] <- grandchild[,1] - (min(grandchild[,1])-max(ind.1[,1])) - (min(father[,1])-max(father[,1]))*a
whole.xy <- rbind(ind.1,parents,haiguusya,grandchild)
whole.col <- c(col.1,rep(col.0,4))
whole.pch <- c(pchs.1,rep(pch.0,length(parents[,1])*2))
whole.cex <- c(cex.1,rep(cex.0,4)*0.5)
plot(whole.xy,col=whole.col,cex=whole.cex,pch=whole.pch)
segments(xy[e.list[,1],1],xy[e.list[,1],2],xy[e.list[,2],1],xy[e.list[,2],2],col="gray",lty=3)
points(ind.1,col=col.1,cex=cex.1,pch=pchs.1)


