- 昨日の続き
- マイクロアレイデータをクラスタリングした
- フェノタイプと検定して、FDR補正してみる
Ns <- 500
Nm <- 1000
Ns.pt <- 10
Nm.pt <- 10
trail <- matrix(rnorm(Ns.pt*Nm.pt),Ns.pt,Nm.pt)
trail <- apply(trail,2,cumsum)
library(rgl)
plot3d(trail[,1:3])
matplot(trail,type="l")
library(MCMCpack)
ps <- rdirichlet(1,rep(1,Ns.pt))
pm <- rdirichlet(1,rep(1,Nm.pt))
ss <- sample(1:Ns.pt,Ns,replace=TRUE,prob=ps)
sm <- sample(1:Nm.pt,Nm,replace=TRUE,prob=pm)
M <- trail[ss,sm]
M <- jitter(M,1000)
phenotype <- apply(M,1,sum)
phenotype <- (sign(phenotype - mean(phenotype)) + 1)/2
phenotype[1:(4*Ns/5)] <- phenotype[sample(1:(4*Ns/5))]
group1 <- which(phenotype==0)
group2 <- which(phenotype==1)
p <- apply(M,2,function(x){t.test(x[group1],x[group2])[[3]]})

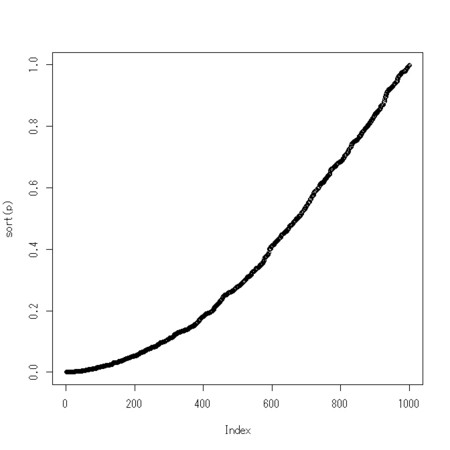
plot(sort(p))
fdr.p <- p.adjust(p,"fdr")

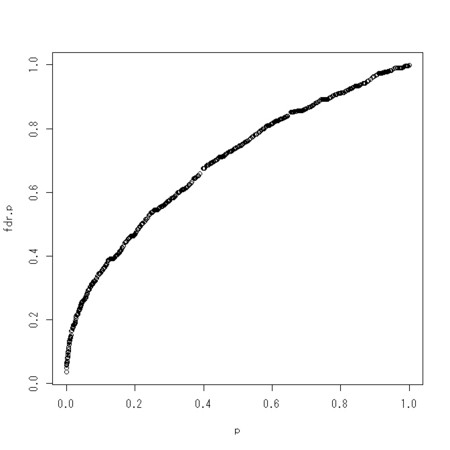
plot(p,fdr.p)
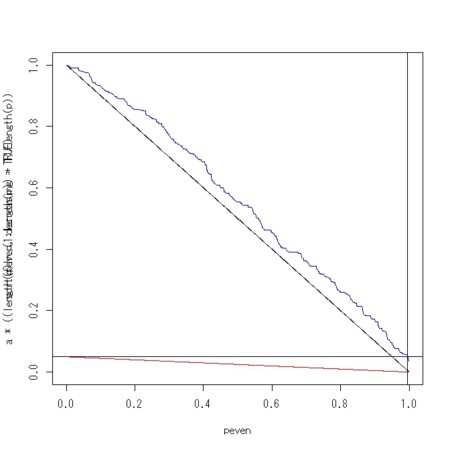
- 補正の具合を図を使って調べる(こちらから)
- 図、右端にごくわずか、補正後も有意な検定があることがわかる

peven<-ppoints(length(p),a=0)
a=0.05
plot(peven,sort(peven,decreasing=TRUE),xlim=c(0,1),ylim=c(0,1),type="l")
par(new=TRUE)
plot(peven,a*((length(p)-(1:length(p))+1)/length(p)),xlim=c(0,1),ylim=c(0,1),type="l",col="red")
par(new=TRUE)
plot(peven,sort(fdr.p,decreasing=TRUE),xlim=c(0,1),ylim=c(0,1),type="l",col="blue")
abline(h=a)
abline(v=peven[length(which(fdr.p>a))])


