- 昨日の記事で時間に関して離散的な観測データについて、そのまま・差分・累積をとり、それについて、統計量を作ってみることを書いた
- 今日の記事では、それを、良く知られた解析法が適用可能なデータ例に当てはめてみる
- 生存解析(「生死」を経時的に追跡するの)は、そのような例
- 以下では、「生死」をフェノタイプとせずに、「発病」をフェノタイプとして、「死亡」を追跡打ち切りとするような場合とする
- 2アレル型多型のジェノタイプが発病時期に影響するような場合
- ジェノタイプと発病・有病が関係する形式として、次のようなモデルを想定している
- ジェノタイプが発病しやすさに影響することで、そのジェノタイプを保有している期間が長ければ長いほど、発病する
- 言い換えると、すべての個人は発病するが、発病年齢が死亡よりも若ければ発病する、というモデル
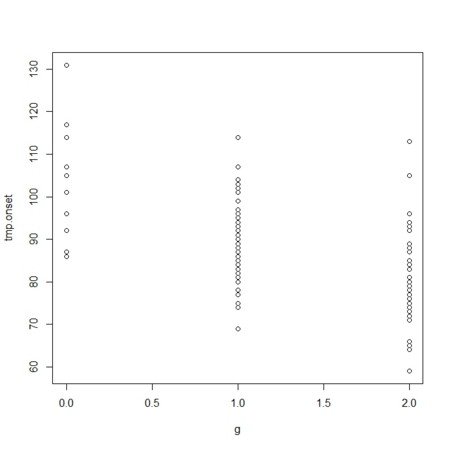
- ジェノタイプ別の発病年齢(寿命が無限大である場合の仮の発病年齢)

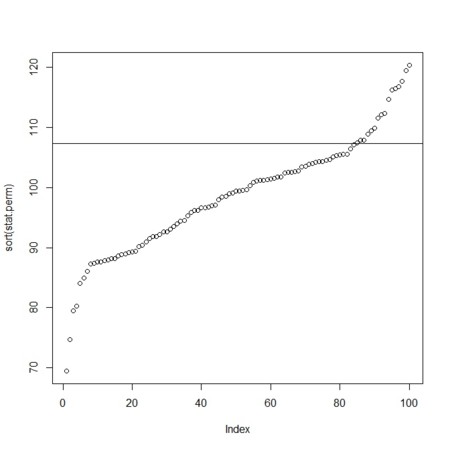
- 観測統計量とそのパーミュテーションによる統計量分布との関係

f<-0.3
p<-c(f^2,2*f*(1-f),(1-f)^2)
N<-100
g<-sample(0:2,N,replace=TRUE,prob=p)
table(g)
t<-0:100
age<-sample(20:100,N,replace=TRUE)
a<-0
b<--10
tmp.onset<-round(20+exp(a+b*g+rnorm(N)*5))
tmp.onset<-100+b*g+round(rnorm(N)*10)
plot(g,tmp.onset)
length(which(tmp.onset<=max(t)))/N
T1.list<-list()
for(i in 1:N){
T1.list[[i]]<-list(time=c(0,round(age[i]/2),age[i]),value=rep(g[i],3))
}
T2.list<-list()
for(i in 1:N){
if(tmp.onset[i]<age[i]){
tmp.time<-c(0,tmp.onset[i]-1,tmp.onset[i],age[i])
tmp.value<-c(0,0,1,1)
T2.list[[i]]<-list(time=tmp.time,value=tmp.value)
}else{
T2.list[[i]]<-list(time=c(0,round(age[i]/2),age[i]),value=rep(0,3))
}
}
stat.ori<-0
for(i in 1:N){
tmp<-my.TimeCorr(T1.list[[i]],T2.list[[i]],di1=-1,di2=1,perm=FALSE)
stat.ori<-stat.ori+tmp$stat.ori
}
Nperm<-100
stat.perm<-rep(0,Nperm)
for(i in 1:Nperm){
shG<-sample(g)
for(j in 1:N){
tmpT1<-T1.list[[j]]
tmpT1$value<-rep(shG[j],3)
tmpout<-my.TimeCorr(tmpT1,T2.list[[j]],di1=-1,di2=1,perm=FALSE)
stat.perm[i]<-stat.perm[i]+tmpout$stat.ori
}
}
plot(sort(stat.perm),ylim=range(stat.ori,stat.perm))
abline(h=stat.ori)
perm.p<-length(which(stat.perm>=stat.ori))/Nperm

library(cmprsk)
s.time<-rep(0,N)
s.censor<-rep(0,N)
s.group<-g
for(i in 1:N){
if(tmp.onset[i]<age[i]){
s.time[i]<-tmp.onset[i]
s.censor[i]<-1
}else{
s.time[i]<-age[i]
}
}
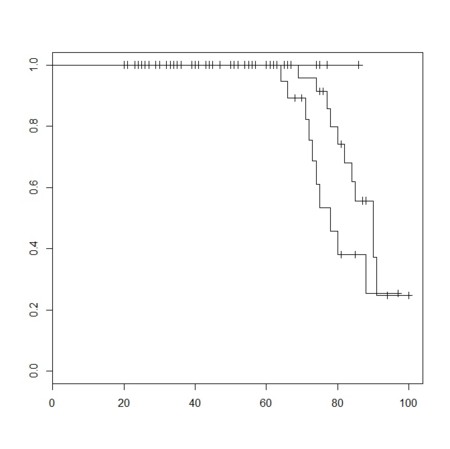
result <- survfit(Surv(s.time,s.censor) ~ s.group, type="kaplan-meier")
summary(result)
plot(result, conf.int=F)
survdiff(Surv(s.time,s.censor) ~ s.group)
perm.p
- まったくもって、survdiff() (これはログランクテスト)の結果と合わない
- 合わないことの一つの理由は、多人数からの統計量の算出がちょっとまずいのでは、ということ
- 合わないことのもう一つの理由は、こちらにあるように(ログランクと一般化ウィルコクソンとでも、相関が悪いし、そこに、線形回帰のようなものを入れても、やっぱり相関が悪いこと)と関係するのかもしれない
- 以下はいろいろ試してぐちゃぐちゃになったソース(自分以外に何の役にも立たないもの)
f<-0.3
p<-c(f^2,2*f*(1-f),(1-f)^2)
N<-100
g<-sample(1:3,N,replace=TRUE,prob=p)
table(g)
t<-0:100
age<-sample(90:100,N,replace=TRUE)
a<-80
b<--10
tmp.onset<-round(20+exp(a+b*g+rnorm(N)*5))
tmp.onset<-100+b*g+round(rnorm(N)*10)
plot(g,tmp.onset)
length(which(tmp.onset<=max(t)))/N
T1.list<-list()
for(i in 1:N){
T1.list[[i]]<-list(time=c(0,round(age[i]/2),age[i]),value=rep(g[i],3))
}
T2.list<-list()
for(i in 1:N){
if(tmp.onset[i]<age[i]){
tmp.time<-c(0,tmp.onset[i],age[i])
tmp.value<-c(0,1,1)
T2.list[[i]]<-list(time=tmp.time,value=tmp.value)
}else{
T2.list[[i]]<-list(time=c(0,round(age[i]/2),age[i]),value=rep(0,3))
}
}
library(cmprsk)
s.time<-rep(0,N)
s.censor<-rep(0,N)
s.group<-g
for(i in 1:N){
if(tmp.onset[i]<age[i]){
s.time[i]<-tmp.onset[i]
s.censor[i]<-1
}else{
s.time[i]<-age[i]
}
}
stat.ori<-0
for(i in 1:N){
tmp<-my.TimeCorr(T1.list[[i]],T2.list[[i]],di1=0,di2=1,perm=FALSE)
print(tmp)
stat.ori<-stat.ori+tmp$stat.ori
}
Nperm<-100
stat.perm<-surv.perm<-wil.perm<-rep(0,Nperm)
for(i in 1:Nperm){
shG<-sample(g)
for(j in 1:N){
tmpT1<-T1.list[[j]]
tmpT1$value<-rep(shG[j],3)
tmpout<-my.TimeCorr(tmpT1,T2.list[[j]],di1=0,di2=1,perm=FALSE)
stat.perm[i]<-stat.perm[i]+tmpout$stat.ori
}
tmp.s.group<-shG
out.surv<-survdiff(Surv(s.time,s.censor) ~ tmp.s.group)
surv.perm[i]<-out.surv[[5]]
tmpWil<-Gen.Wil(tmp.s.group,s.censor,s.time)
wil.perm[i]<-tmpWil$p.value
}
plot(sort(stat.perm),ylim=range(stat.ori,stat.perm))
abline(h=stat.ori)
perm.p<-length(which(stat.perm>=stat.ori))/Nperm
plot(stat.perm,wil.perm)
library(cmprsk)
s.time<-rep(0,N)
s.censor<-rep(0,N)
s.group<-g
for(i in 1:N){
if(tmp.onset[i]<age[i]){
s.time[i]<-tmp.onset[i]
s.censor[i]<-1
}else{
s.time[i]<-age[i]
}
}
result <- survfit(Surv(s.time,s.censor) ~ s.group, type="kaplan-meier")
summary(result)
surv.perm<-stat.perm2
wil.perm<-stat.perm2
plot(result, conf.int=FALSE)
survdiff(Surv(s.time,s.censor) ~ s.group)
perm.p
stat.ori2<-sum(s.time*s.censor*s.group)
stat.ori3<-sum(1/s.time*s.censor*s.group)
Nperm2<-Nperm3<-100
stat.perm2<-rep(0,Nperm2)
stat.perm3<-stat.perm2
surv.perm<-stat.perm2
wil.perm<-stat.perm2
for(i in 1:Nperm2){
tmp.s.group<-sample(s.group)
stat.perm2[i]<-sum(s.time*s.censor*tmp.s.group)
stat.perm3[i]<-sum(1/s.time*s.censor*tmp.s.group)
out.surv<-survdiff(Surv(s.time,s.censor) ~ tmp.s.group)
surv.perm[i]<-out.surv[[5]]
tmpWil<-Gen.Wil(tmp.s.group,s.censor,s.time)
wil.perm[i]<-tmpWil$p.value
}
plot(sort(stat.perm2),ylim=range(stat.ori2,stat.perm2))
abline(h=stat.ori2)
perm.p2<-length(which(stat.perm2>=stat.ori2))/Nperm2
plot(sort(stat.perm3),ylim=range(stat.ori3,stat.perm3))
abline(h=stat.ori3)
perm.p3<-length(which(stat.perm3>=stat.ori3))/Nperm3
plot(stat.perm2,wil.perm)
plot(surv.perm,wil.perm)


